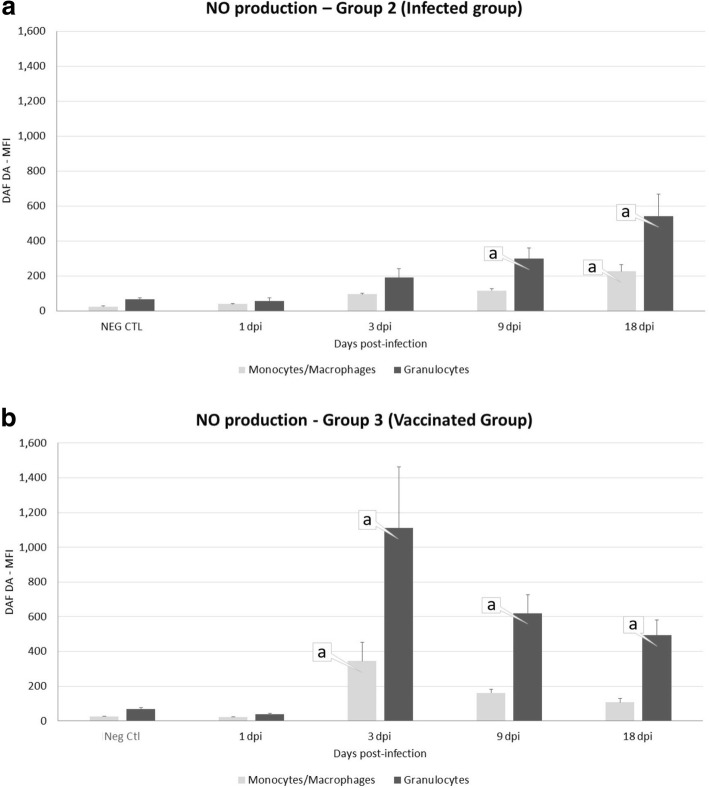
Fig. 6.
Mean fluorescence intensity of NO production (DAF DA) in the peritoneal fluid of sheep uninfected (Neg Ctl, Group 1, a, b), infected (Group 2, a) and vaccinated sheep (Group 3, b). Values represent the mean ± standard deviation, SD. “a” indicates significant differences (P < 0.05) between groups

