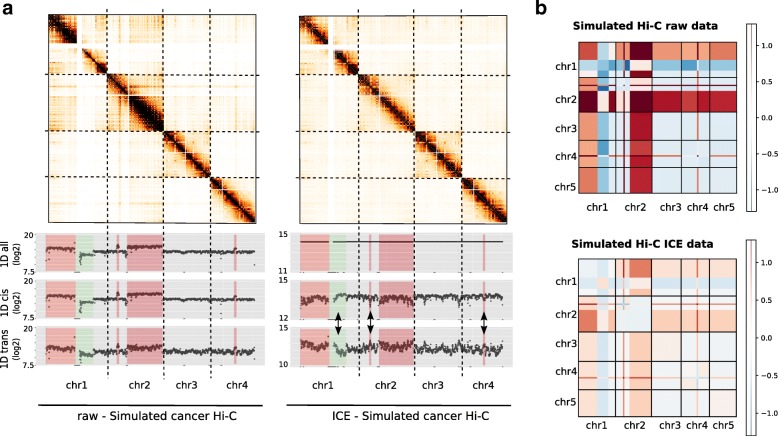
Fig. 2.
Impact of matrix balancing normalization on simulated cancer Hi-C data. a. Simulated Hi-C contact maps (500 kb resolution) of the first four chromosomes and contact frequencies presented as the sum of genome-wide contacts per locus, using either all (inter and intra-chromosomal), cis (intra-chromosomal) or trans (inter-chromosomal) contacts. Rearranged regions are highlighted in red (gain) or green (loss). The 1D profile of ICE data is constant genome-wide as expected under the assumption of equal visibility. However, the iterative correction on simulated cancer data results in an shift of contacts between altered regions (see arrows for examples). b. Block-average error matrix of simulated raw and ICE cancer data (150 Kb resolution) (See Additional file 1: Method 1.4). The iterative correction does not allow to correct for segmental copy number bias

