Fig. 3.

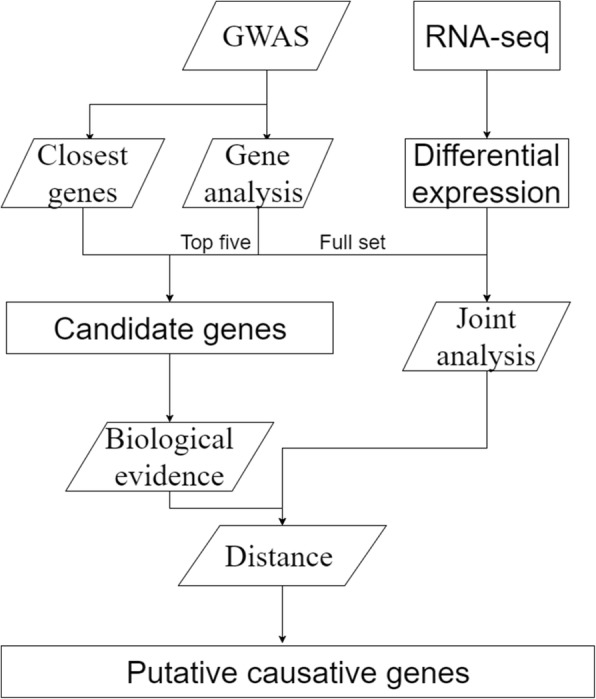
Flow chart of procedure to find putative causal genes. Parallelogram means analysis, rectangle means output, and text above arrow indicates which part of result to use

Flow chart of procedure to find putative causal genes. Parallelogram means analysis, rectangle means output, and text above arrow indicates which part of result to use