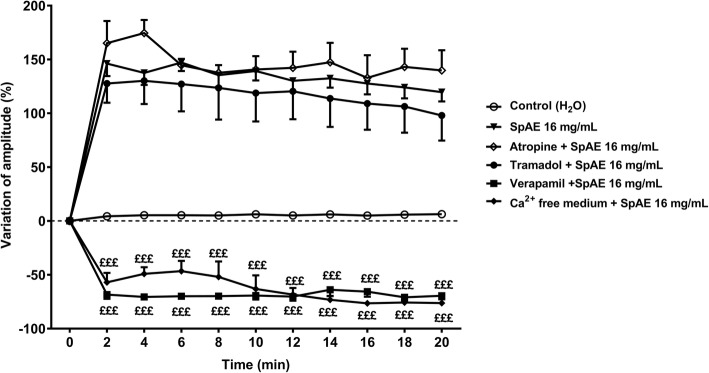
Fig. 6.
Time-response curves of the effect of Sida pilosa aqueous extract and pharmacological blockers on the amplitude of spontaneous contractions of isolated rat ileum. Each point represents the mean ± SEM (n = 5). ANOVA followed by Newman-Keuls multiple comparison test was used for statistical analysis. £££p < 0.001: values are significantly different from those recorded with SpAE 16 mg/mL at each time point

