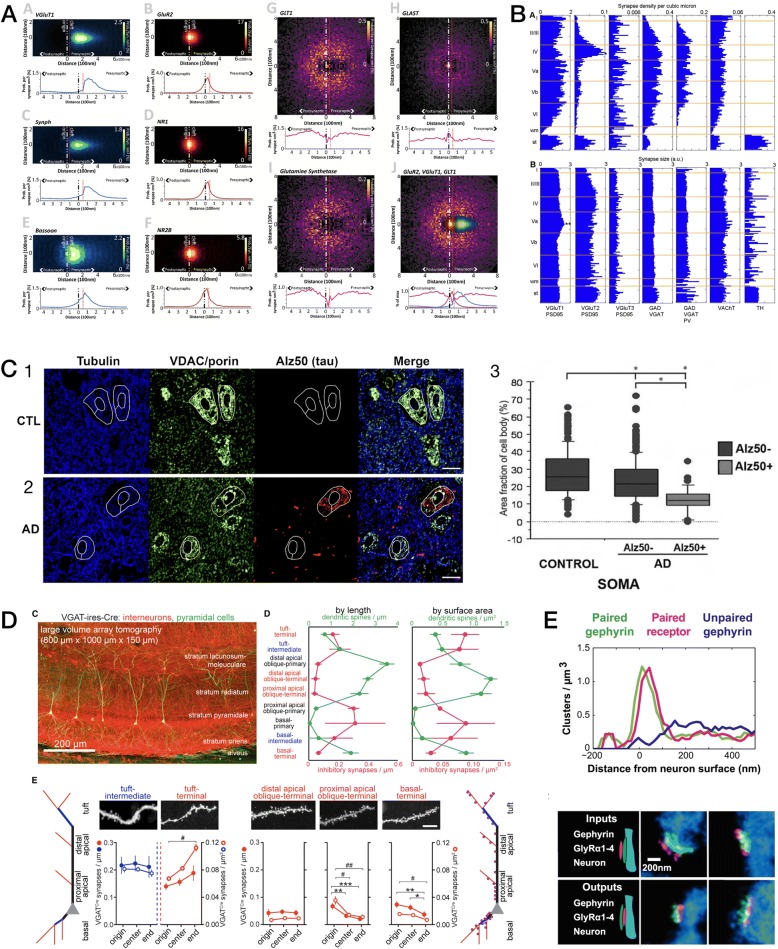
Fig. 9.
Quantitative analysis of AT images. a Nanoscale localization of multiple synaptic proteins along transynaptic axis, generated from 36,977 individual mouse cortical synapses (from Fig. 4 in [93]). b Variations with depth of volume density and size of seven molecular synapse types in mouse somatosensory cortex (from Fig. 5 in [85]). c Somatic mitochondrial distributions are disrupted in both pTau+ and pTau− neurons of superior temporal gyrus from Alzheimer disease (AD) vs control (CTL) human brains (from Fig. 5 in [83]). d Structured spatial patterning of inhibitory synapses onto mouse CA1 pyramidal cell dendrites (from Fig. 2 in [27], Copyright (2016), with permission from Elsevier). e Discrimination of input vs output glycinergic synapses to/from narrow-field amacrine cells by STORM fluorescence nanoscale AT (from Fig. 6 in [63], Copyright (2015), with permission from Elsevier)

