Fig. 2.

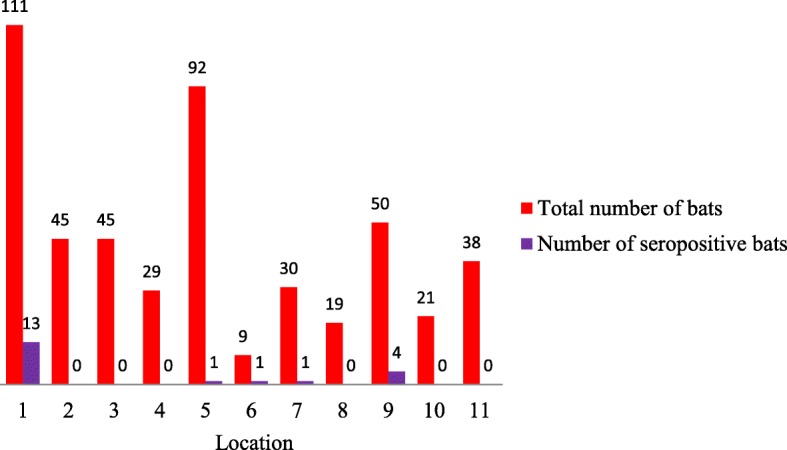
Total number of bats (red bars) and number of seropositive bats (purple bars) per location (1–11). Location designations are the same as on map (Fig. 1)

Total number of bats (red bars) and number of seropositive bats (purple bars) per location (1–11). Location designations are the same as on map (Fig. 1)