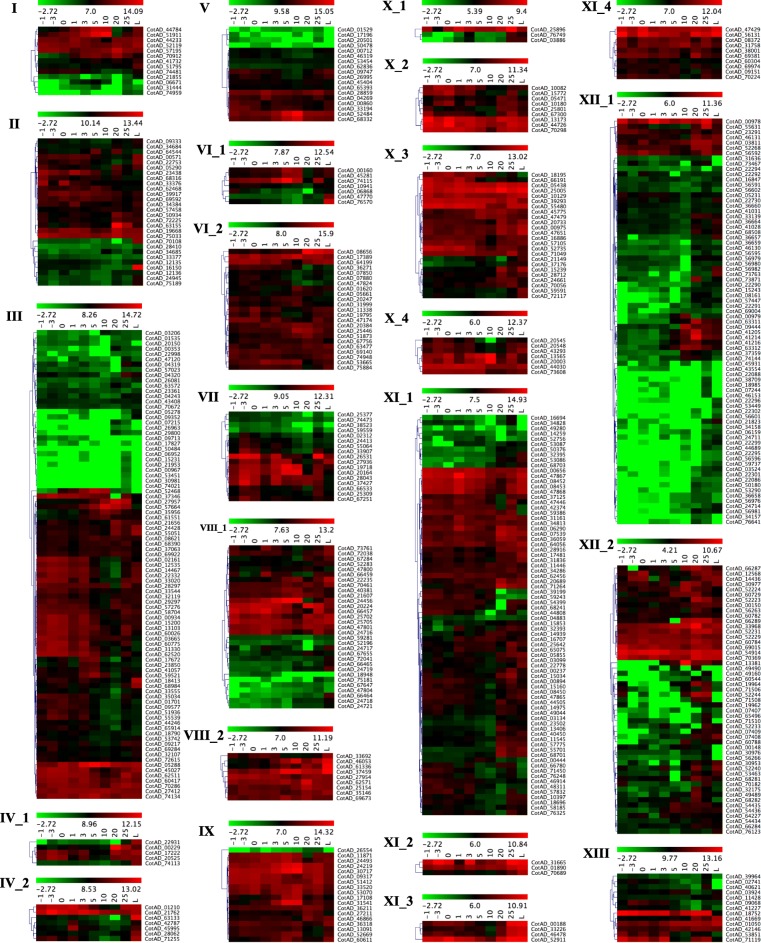
Fig. 4.
Expression analysis of G. hirsutum LRR-RLKs. Hierarchically clustered heatmap for individual subclades of G. hirsutum LRR-RLK genes in − 3 dpa ovule, − 1 dpa ovule, − 0 dpa ovule, 1 dpa ovule, 3 dpa ovule, 5 dpa fiber, 10 dpa fiber, 20 dpa fiber, 25 dpa fiber, and leaves. Scales used to prepare heatmap is included with individual subclade specific heatmaps

