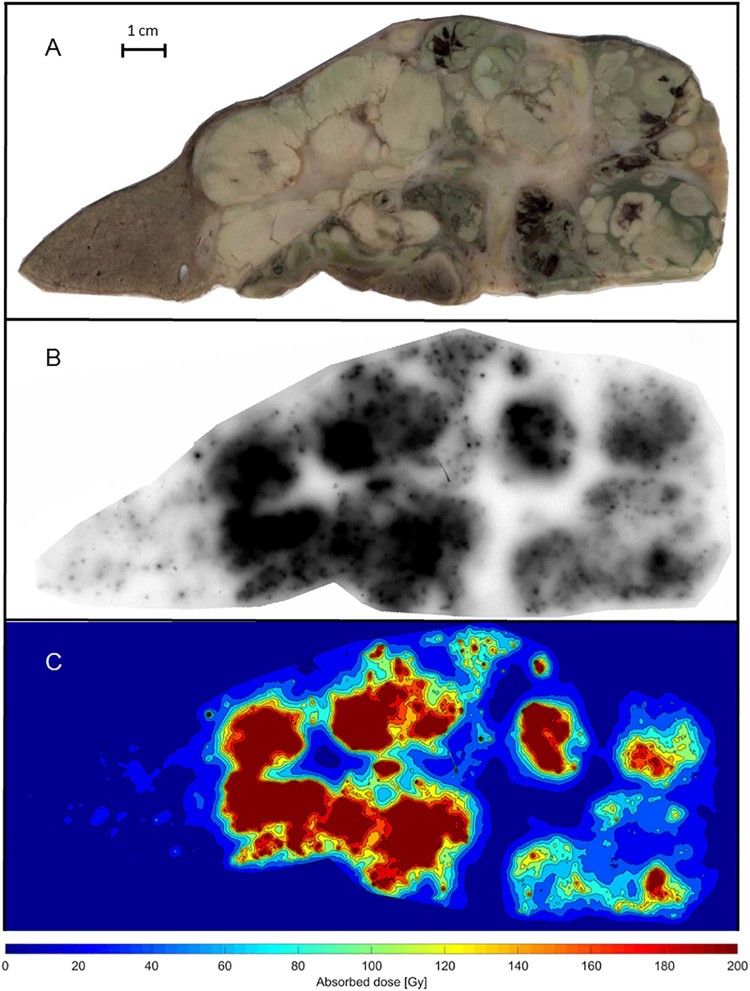
Figure 3.
A-C. Photo, autoradiograph, and isodose curves (Gy) from a slice of the resected liver tissue with hepatocellular carcinoma. Normal tissue can be seen to the left in A and the maximum dose regions are depicted in black in B and dark red in C, which correspond to absorbed doses of at least 200 Gy.

