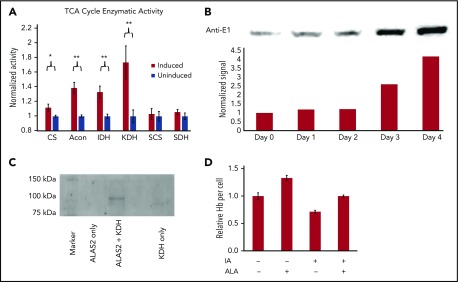
Figure 3.
Activity of TCA cycle enzymes during erythroid differentiation. (A) The activity of 6 TCA cycle enzymes was determined in mitochondrial lysates from undifferentiated and differentiating MEL cells. Activity of cells induced toward erythroid differentiation was normalized to the activity of uninduced cells. CS, citrate synthase; Acon, aconitase; IDH, isocitrate dehydrogenase. Data shown are averages of 5 determinations. Error bars represent ± standard deviation. *P < .05; **P < .01. (B) The induction of KDH subunit E1 during erythropoiesis. E1 levels as detected by western blot analysis in differentiating MEL cells. On top is shown the western blot gel photograph and below is a densitometry analysis of the western blot in which E1 protein levels were normalized to total protein per lane. “Days” represents days postinduction. (C) In vitro protein-protein interaction between KDH and His-tagged ALAS2 is shown. Anti-E1 western blot showing KDH subunit E1 interacts with ALAS2 immobilized on a cobalt resin column. (D) The inhibition of hemoglobinization in differentiating MEL cells by itaconate is shown. Differentiating MEL cultures were treated with 2.5 mM itaconate ± ALA (100 µM [+]) for 4 days before being analyzed for hemoglobin content. All conditions were run in triplicate. Hb, hemoglobin; IA, itaconate.

