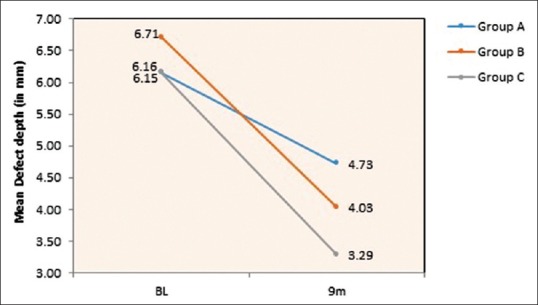
Figure 12.

Graphical representation of intergroup comparison of defect depth from baseline to 9th month follow-up period in Group A-OFD, Group B-OFD + IMP and Group C-OFD + IMP + PRFM. OFD + IMP – Open flap debridement + intra marrow penetration; OFD + IMP + PRFM – Open flap debridement + intra marrow penetration Platelet-rich fibrin matrix
