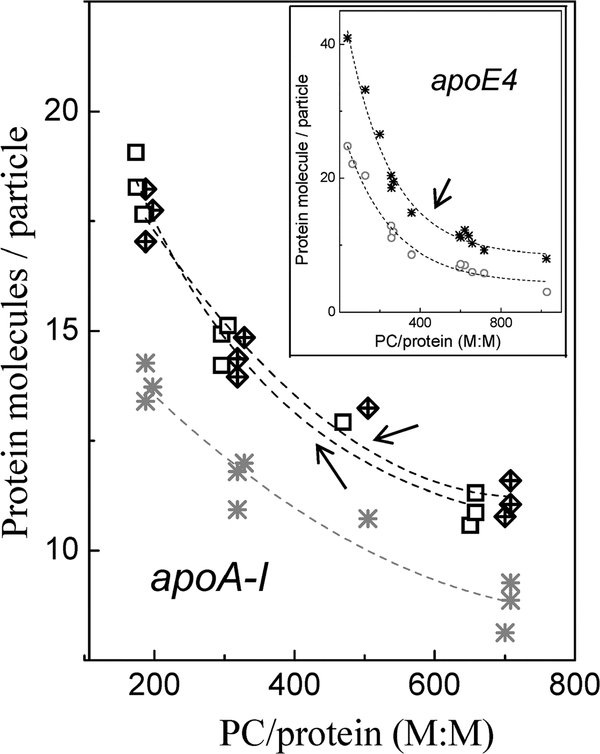
Figure 3.
Number of bound apoA-I molecules per emulsion particle. Numbers of the bound protein molecules per emulsion particle were determined at various PC to protein molar ratios in the incubation mixtures: WT apoA-I (*), apoA-I[Δ(61–78)] (□), and apoA-I- [E110A/E111A] (⊠). The inset shows the number of bound apoE-4 molecules per emulsion particle:15 WT apoE4 (*) and apoE4-mut1 (○). Black symbols are used for the data for the proteins that induce HTG; gray symbols are used for the data for the proteins that do not induce HTG. Arrows point to the curves for the proteins that induce HTG.

