
Figure 9.
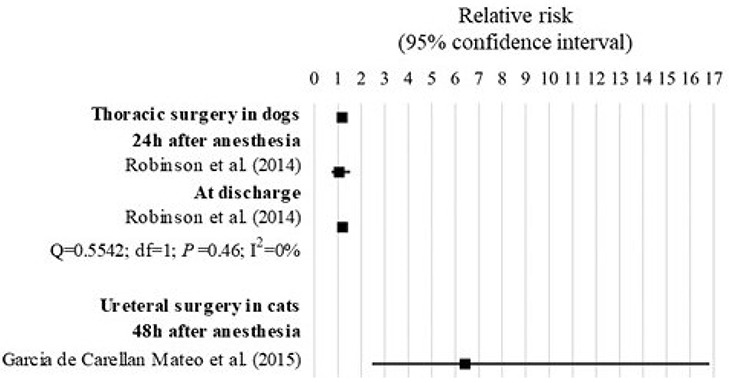
Forest plot showing the increased risk of anesthesia-related death in specific populations with ASA PS ≥III compared with ASA PS <III. Q, Cochran's Q (P < 0.05 = heterogeneity; P > 0.05 = homogeneity); I2, proportion of the inconsistency between the findings of the studies; df , degrees of freedom.