. 2018 Aug 28;7:e37082. doi: 10.7554/eLife.37082

Figure 1. Pseudomonas aeruginosa releases a germination repressive activity (GRA).

(A) Pictures show Arabidopsis plants 4 days after sowing WT seeds in germination medium lacking bacteria (MS) or containing a given Pseudomonas species as indicated. Escherichia coli was included as a Gram-negative non-Pseudomonas species control. Note that seeds in close proximity of P. aeruginosa strains mostly did not germinate. Red arrows indicate distance used to calculate germination percentage in B. (B) Same experiment as in A. Representative pictures of plants 4 days after sowing seeds in germination medium in absence (MS) or presence of bacteria as indicated. Histograms show seed germination percentage 4 days upon sowing seeds in absence (MS) or presence of bacteria as indicated. Data represent mean ± standard deviation (nine replicates, n = 300–350). Lower case letters above histograms are used to establish whether two seed germination percentage values are statistically significantly different as assessed by one-way ANOVA followed by a Tukey HSD test (p<0.05): different letters denote statistically different values.

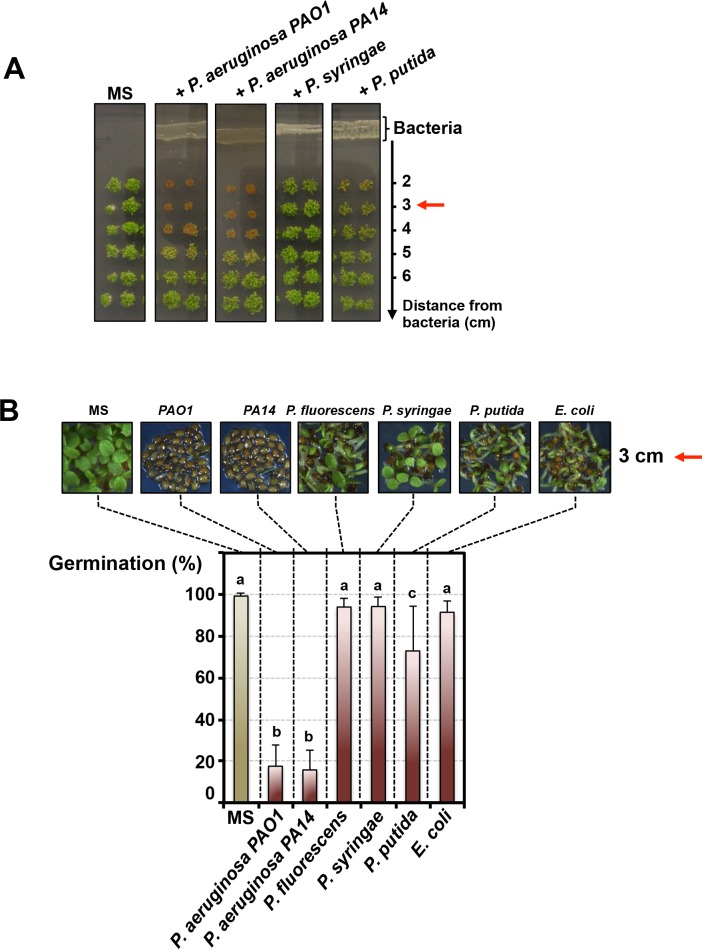
Figure 1—source data 1. Germination percentage for each replicate.
DOI: 10.7554/eLife.37082.005

Figure 1.

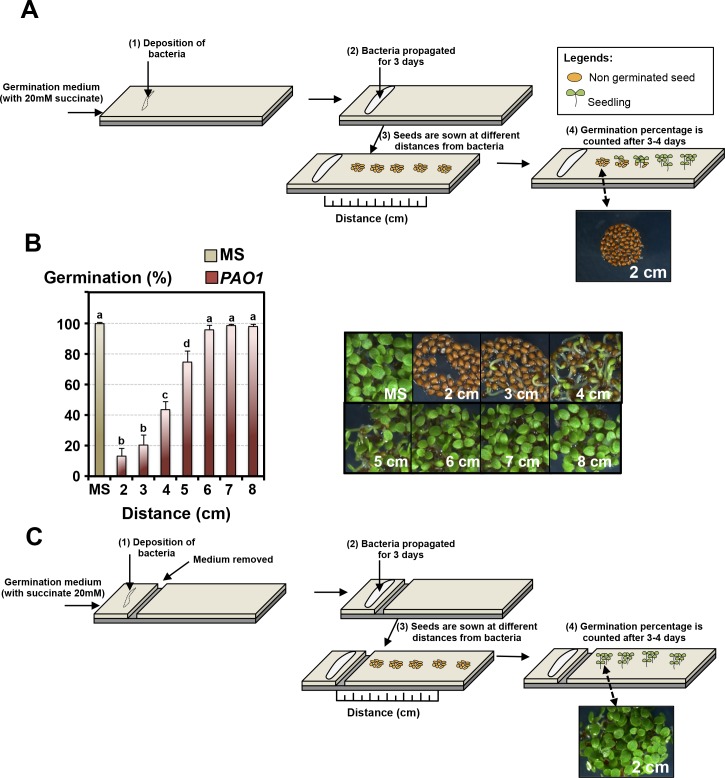
Figure 1—figure supplement 1. Pseudomonas aeruginosa releases a diffusible GRA in the germination medium.

Figure 1—figure supplement 1.

(A) Experimental procedure to assess germination of Arabidopsis WT seeds exposed to Pseudomonas. (1) Bacteria are streaked on germination medium supplemented with 20 mM succinate as a carbon source, (2) after letting bacteria grow for 3 days, (3) seeds are sown at different distances from the bacteria in order to (4) assess their germination thereafter. (B) Histogram depicts germination percentage 3 days after sowing WT seeds using the procedure described in A. Representative pictures of plant material 3 days after sowing are shown for each distance as indicated. Data represent mean ± standard deviation (four replicates, n = 200–250) and statistically significant differences were assessed by one-way ANOVA followed by a Tukey HSD test (p<0.05). (C) Same experimental procedure as in A except that the medium separating bacteria and seeds is initially removed.