Figure 4.

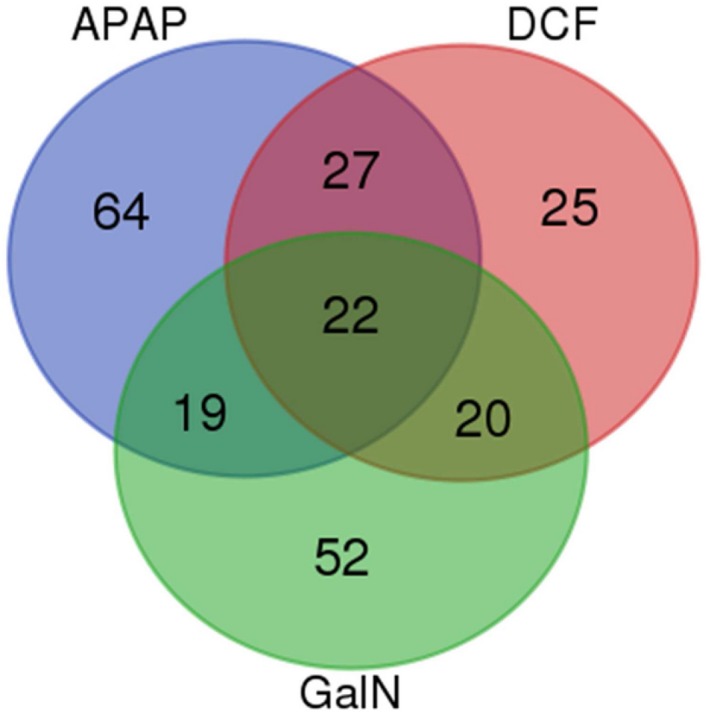
Venn diagram of EV proteomics analysis. Comparison of the proteins regulated for each treatment with respect to the proteomics analysis of EVs obtained from untreated hepatocytes.

Venn diagram of EV proteomics analysis. Comparison of the proteins regulated for each treatment with respect to the proteomics analysis of EVs obtained from untreated hepatocytes.