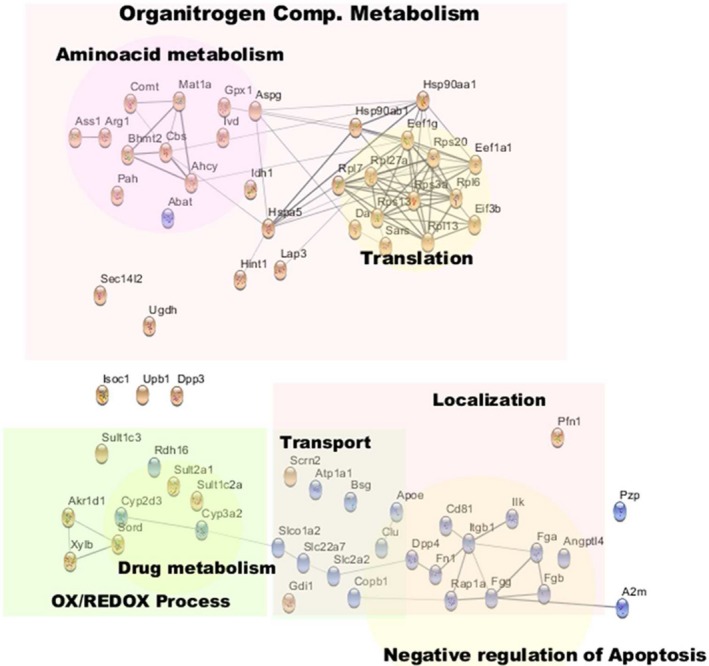
Figure 5.

Annotated network of common molecules regulated by hepatotoxic treatments. The network included all of those molecules found significantly regulated for all three treatments, plus those molecules found to be significantly regulated in two treatments and regulated with the same trend for the other treatment. Red and blue colors denote, respectively, an increase or decrease in the amount of each protein in EVs secreted by drug‐treated hepatocytes, in comparison to untreated cells. Abbreviations: Ahcy, S‐adenosylhomocysteine hydrolase; Angptl4, angiopoietin‐like 4; Asgp, L‐asparaginase; Ass1, argininosuccinate synthase 1; Bhmt2, betaine‐homocysteine S‐methyltransferase 2; Bsg, basigin; Cbs, cystathionine‐beta‐synthase; Copb1, beta‐subunit of coatomer; Fga, Fgb, Fgg, fibrinogens; Fn1, fibronectin; Itgb1, integrin 1b; Ilk, integrin‐linked kinase; Mat1a, S‐adenosyl‐methyl transferase; Rap1a, Ras‐related protein.
