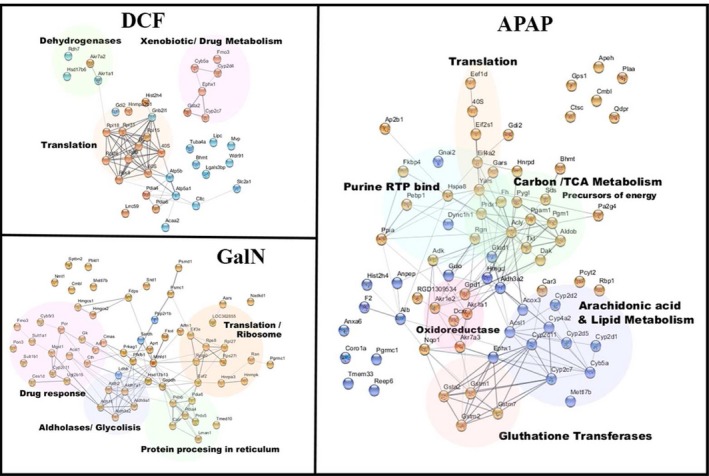
Figure 6.

Annotated network of regulated molecules specific for each treatment. The network included for each treatment, all those molecules found to be significant only for that treatment, those molecules found to be significantly regulated in just another treatment, and the direction of regulation are not congruent among the three treatments.
