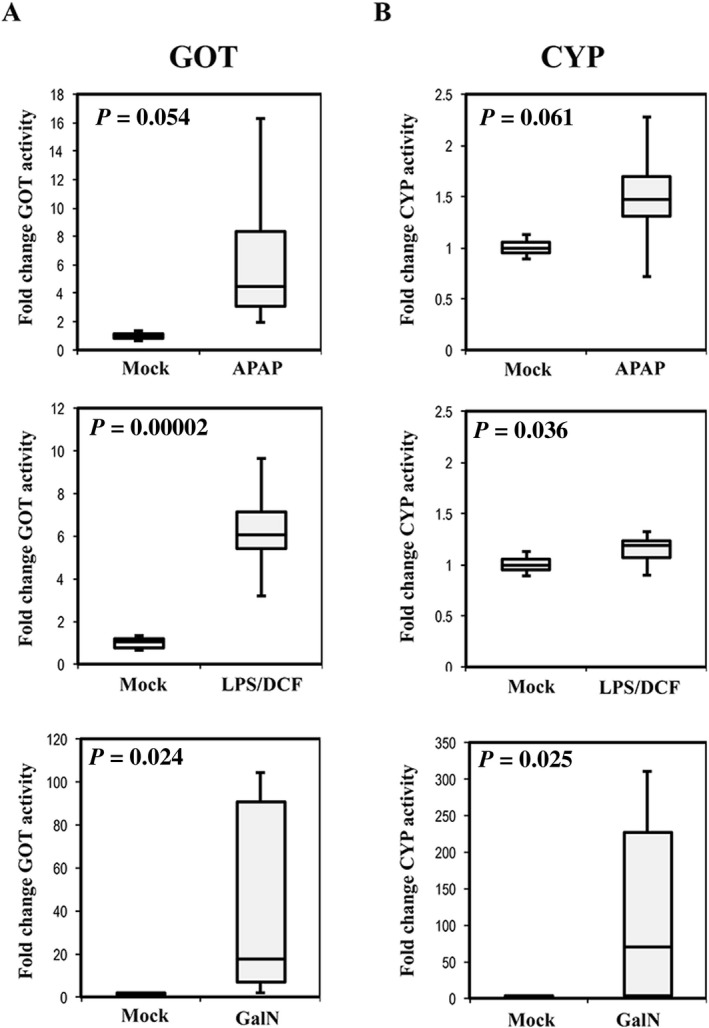
Figure 10.

Serum levels of GOT and CYP activities in rats treated with different hepatotoxic compounds. Box plots of the transaminase GOT (A) and CYP P450 2d1 (B) activities were determined in serum of mock‐treated rats or those treated with APAP, LPS/DCF, or GalN. Activities were referred to the average activity obtained in mock group. Each experimental group was formed by eight animals (n = 8). P values of t test analysis are indicated.
