Figure 3.

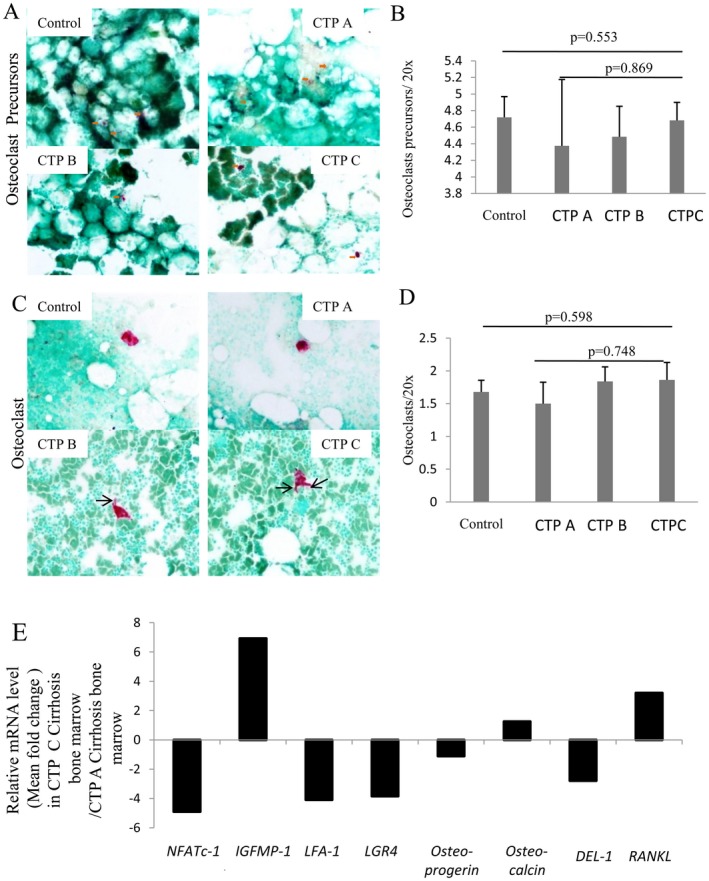
Osteoclasts and osteoclast precursors. (A) Representative photomicrographs showing mononucleated osteoclastic progenitor cells (red, with orange arrows) in control and in cirrhosis subgroups CTP A, B, and C (TRAP staining, magnification ×200). (B) Bar graph showing mean ± SE of osteoclastic progenitors in control and cirrhosis subgroups CTP A, B, and C. (C) Multinucleated osteoclasts (red) in control and in cirrhosis subgroups CTP A, B, and C (TRAP staining, magnification ×200). Osteoclast in CTP C shows cytoplasmic podia, indicating the activated osteoclast form (black arrow). Activation is less in CTP B, and there is no activated form in CTP A and control cases. (D) Bar graph showing mean ± SE of osteoclasts in control and in CTP A, B, and C. (E) Relative mRNA level of indicated osteoclast effecter genes in BM tissue of CTP C with respect to CTP A patients with cirrhosis. Abbreviations: CTP, Child‐Turcotte‐Pugh; IGFBP‐1, insulin like growth factor protein‐1; mRNA, messenger RNA; TRAP, tartrate‐resistant acid phosphatase.
