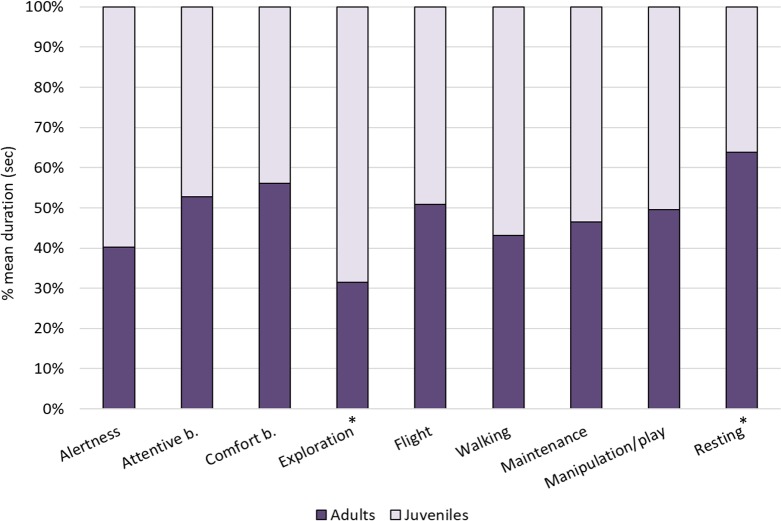
Figure 2. Individual behaviours in adults and juveniles.
The bar-chart reports the % mean duration (in seconds) of different individual behaviours performed by both adult and juvenile ibises. Asterisks indicate categories in which a significant difference between age groups was found (Mann–Whitney test: p < 0.05).

