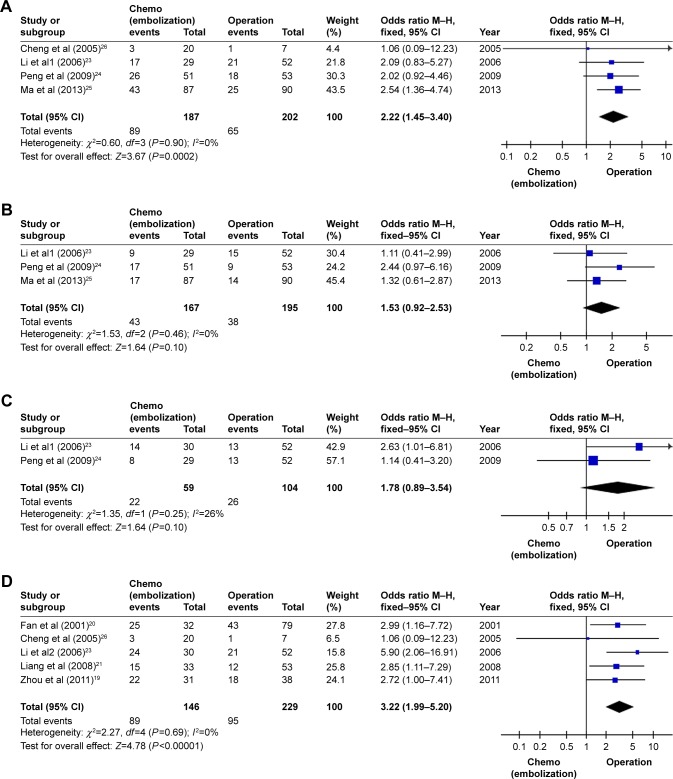
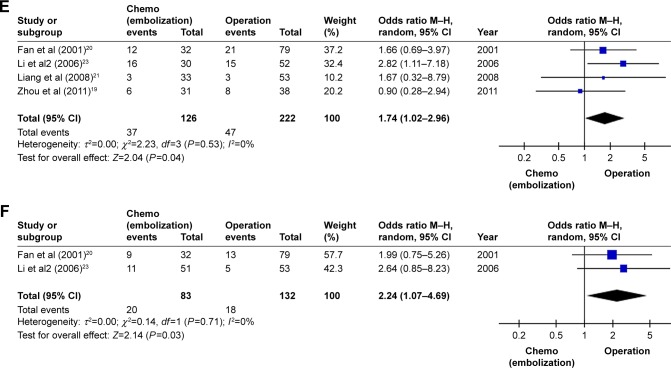
Figure 4.
Forest plot of the subgroup analysis of the 1-, 3-, and 5-year survival rates.
Notes: (A) Analysis of the 1-year survival rate for TACE. (B) Analysis of the 3-year survival rate for TACE. (C) Analysis of the 5-year survival rate for TACE. (D) Analysis of the 1-year survival rate for chemotherapy. (E) Analysis of the 3-year survival rate for chemotherapy. (F) Analysis of the 5-year survival rate for chemotherapy. Li et al for reference 23, 1 for TACE study and 2 for chemotherapy study.
Abbreviations: TACE, transarterial chemoembolization; M–H, Mantel–Haenszel test.


