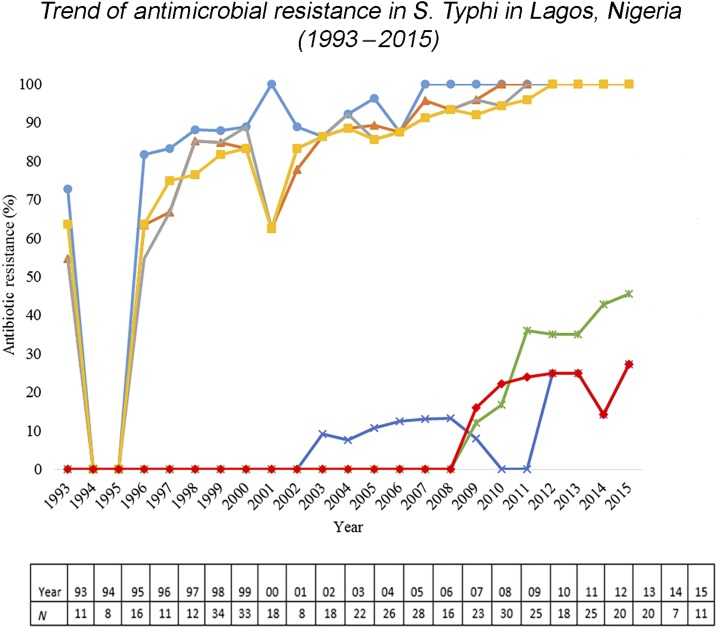
Figure 2.
Trend of antimicrobial resistance in Salmonella enterica serovar Typhi (S. Typhi) in Lagos, Nigeria (1993–2015). Antimicrobial resistance trends in Lagos from 1993 to 2015. The light blue line shows the percentage of ampicillin-resistant S. Typhi. The orange line shows the percentage of chlora6mphenicol-resistant S. Typhi. The gray line shows the percentage of co-trimoxazole-resistant S. Typhi. The yellow line shows the percentage of tetracycline-resistant S. Typhi. The dark blue line shows the percentage of ciprofloxacin-resistant S. Typhi. The green line shows the percentage of cefuroxime-resistant S. Typhi. Cefuroxime was introduced as of 2003. The red line shows the percentage of cefotaxime-resistant S. Typhi. Cefotaxime was introduced as of 2008.

