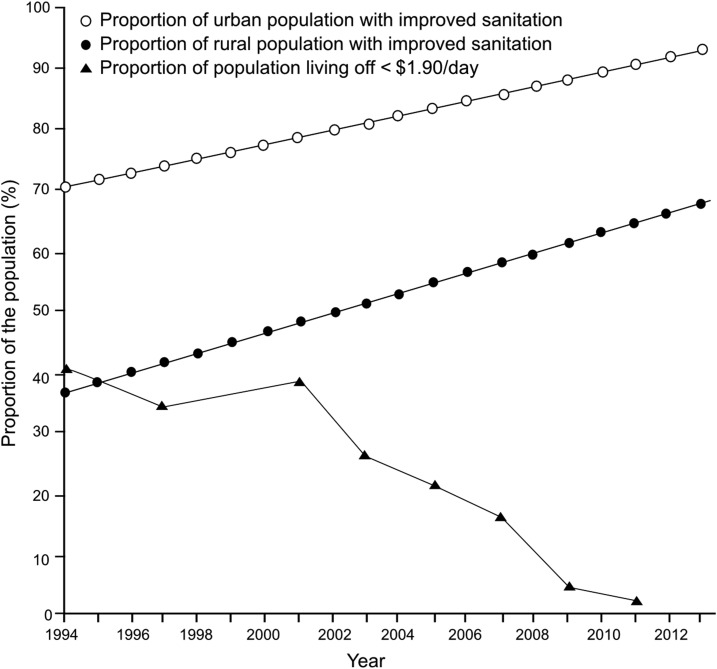
Figure 4.
The reduction of poverty and improvements in sanitation in Vietnam. Plots showing the proportion of the Vietnamese population living on < $1.90 a day (black triangles), the proportion of the Vietnamese rural population with improved sanitation (black circles), and the proportion of the Vietnamese urban population with improved sanitation (white circles) from 1994 to 2013.

