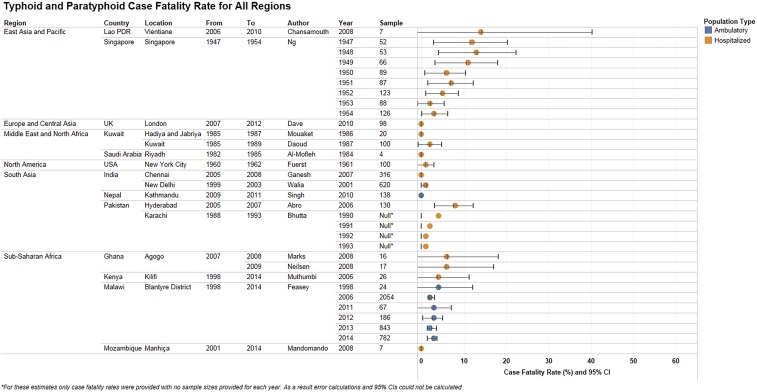
Figure 7.
Typhoid and paratyphoid case fatality rates, by region. Case fatality rates due to typhoid and paratyphoid fever as diagnosed by blood culture in hospitalized and ambulatory populations for all regions. Rates are shown as a percentage along with 95% confidence intervals. Null values refer to studies where mortality estimates were provided with no sample size.

