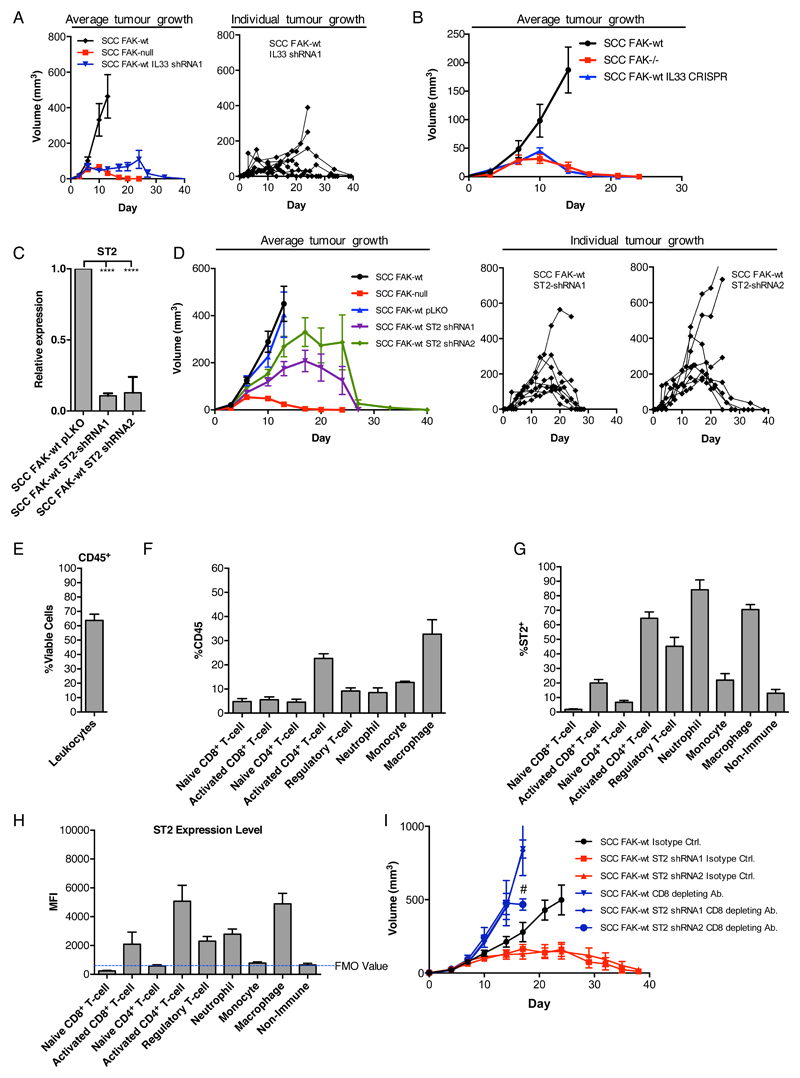
Figure 3. IL33 and sST2 support SCC tumour growth through suppressing the anti-tumour immune response.
(A and B) Representative growth of FAK-wt, FAK-/-, and FAK-wt IL33-shRNA1 (A) or FAK-wt IL33-CRISPR (B) SCC tumors after orthotopic subcutaneous implantation. (C) qRT-PCR analysis of ST2 expression in FAK-wt pLKO, FAK-wt ST2-shRNA1, and FAK-wt ST2-shRNA2 SCC cells. (D) Growth of FAK-wt ST2-shRNA (pools 1 and 2) SCC tumors after orthotopic subcutaneous implantation. (E) CD45+ cells as a percentage of live cells isolated from FAK-wt SCC tumors 12 days after implantation. (F) Abundance of different immune cell populations as a percentage of CD45+ cells. Marker sets used to identify cell populations are listed in fig. S3. (G) Percentage ST2+ cells in different immune cell populations. (H) Mean fluorescent intensity of ST2 expression in different immune cell populations. (I) Representative growth of FAK-wt, FAK-wt ST2-shRNA1, and FAK-wt ST2-shRNA2 SCC tumors receiving treatment with either a CD8-depleting antibody or isotype control antibody. Statistics in C, ****p ≤ 0.0001 by Tukey corrected one-way ANOVA. Data are mean ± S.E.M, n = 3 for q(RT)-PCR, n = 6-8 tumors.

