Figure 1.
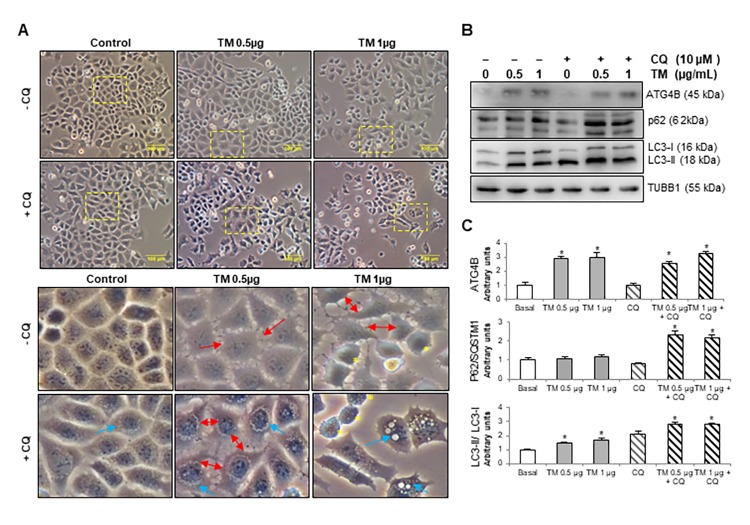
Tunicamycin induces changes in cell morphology, ATG4B expression and autophagy activation in MLE12 cells. (A) Phase contrast images of mouse epithelial MLE12 cells treated with vehicle control or 0.5 and 1 μg/ml tunicamycin alone or in combination with chloroquine for 24h. The line scale bar represents 100 μm. Lower panels represent magnified pictures of boxed area in the corresponding upper panels. Red arrows point out loss of cell-cell contacts, blue arrows indicate accumulation of vacuoles in cytoplasm and yellow asterisk point out apoptotic-like cells. (B) Representative immunoblots of ATG4B, LC3-I/ II, and p62 in mouse alveolar epithelial MLE12 cells treated with vehicle control or 0.5 and 1 μg/ml tunicamycin alone or in combination with chloroquine for 24h. β-tubulin was used as loading control. (C) Densitometry. Protein levels were normalized to vehicle control. Results represent mean ± SD. Statistical significance was determined by one-way ANOVA (* p< 0.05).

