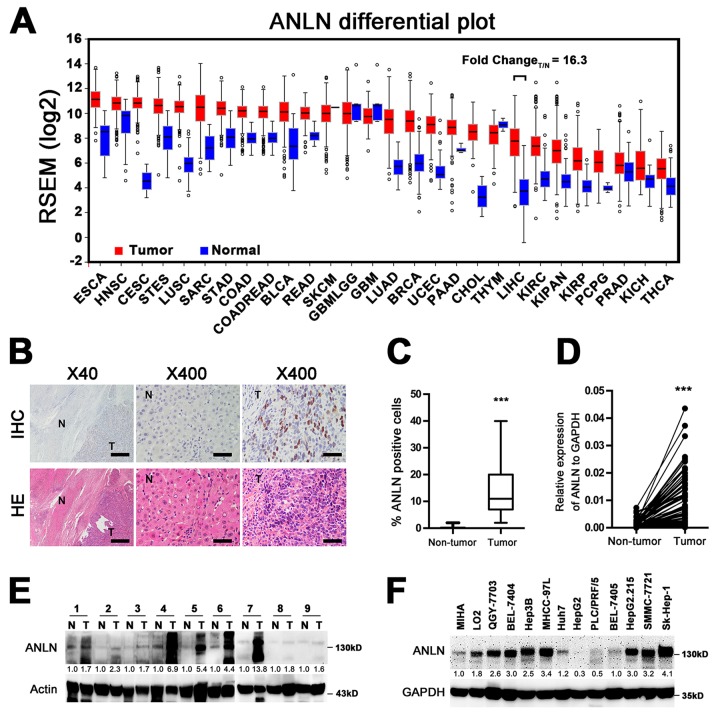
Figure 1.
ANLN is highly expressed in hepatocellular carcinoma. (A) The mRNA levels of ANLN in global human cancer tissues (red) and non-tumor tissues (blue) were analyzed using the TCGA database (http://firebrowse.org/). Noticeably, the fold change of tumor vs normal tissue in hepatocellular carcinoma was 16.3. ESCA: Esophageal carcinoma; HNSC: Head and neck squamous cell carcinoma; CESC: Cervical squamous cell carcinoma and endocervical adenocarcinoma; STES: Stomach and esophageal carcinoma; LUSC: Lung squamous cell carcinoma; SARC: Sarcoma; STAD: Stomach adenocarcinoma; COAD: Colon adenocarcinoma; COADREAD: Colon and rectum adenocarcinoma; BLCA: Bladder urothelial carcinoma; READ: Rectum adenocarcinoma; SKCM: Skin Cutaneous melanoma; GBMLGG: Glioblastoma multiforme and brain lower grade glioma (GBM + LGG); GBM: Glioblastoma multiforme; LUAD: Lung adenocarcinoma; BRCA: Breast invasive carcinoma; UCEC: Uterine corpus endometrial carcinoma; PAAD: Pancreatic adenocarcinoma; CHOL: Cholangiocarcinoma; THYM: Tymoma; LIHC: Liver hepatocellular carcinoma; KIRC: Kidney renal clear cell carcinoma; KICH: Kidney chromophobe; KIRP: Kidney renal; KIPAN: Pan-kidney cohort (KICH + KIRC+ KIRP); PCPG: Pheochromocytoma and paraganglioma; PRAD: Prostate adenocarcinoma; THCA: Tyroid carcinoma. (B) Representative image of ANLN expression in HCC tissue and matched adjacent tissue by IHC and HE analyses. Scale bar for the left panel: 500 μm; Scale bar for the right panel: 50 μm. T: tumor; N: non-tumor. (C) Quantification of the percentage of ANLN-positive cells in tumor tissues and non-tumor tissues from 201 HCC slices. ***P < 0.001. (D) The mRNA levels of ANLN from 81 pairs of HCC tissues and matched adjacent non-tumor tissues were tested by quantitative PCR. GAPDH was used as an internal control. ***P < 0.001. (E) The protein levels of ANLN in 9 pairs of HCC tissues and matched non-tumor tissues were determined by western blotting assay. The relative fold changes of T compared with N are shown below. T: tumor; N: non-tumor. (F) ANLN expression in HCC cell lines. The relative fold changes of all cell lines compared with MIHA are shown below.

