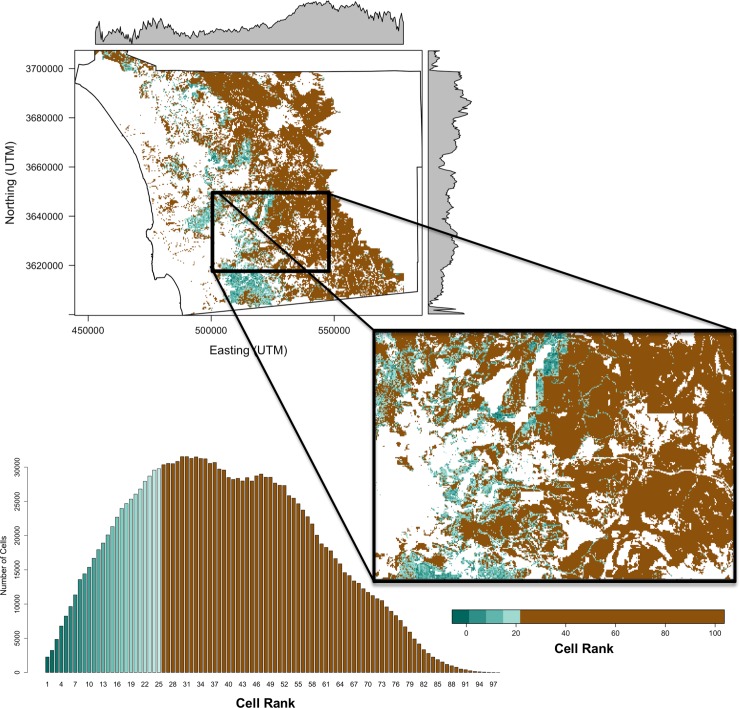
Fig 8. A detailed view of the rankings for the fire (F) and species (S) criteria.
Ranks are shown for the entire County (top left). The median grid cell ranks for each y-coordinate (northing) is shown on the right margin, and the median grid cell ranks for each x-coordinate (easting) is shown on the top margin. Note that a lower median rank indicates a higher priority. An enlarged region along a gradient of ranks is shown on the right. A bar plot of the cell ranks, colored in the same way as in the maps, is shown on the lower left. All ranks at or below the 25th percentile transition from red to yellow as the rank increases. All ranks above the 25th percentile are shown in green.

