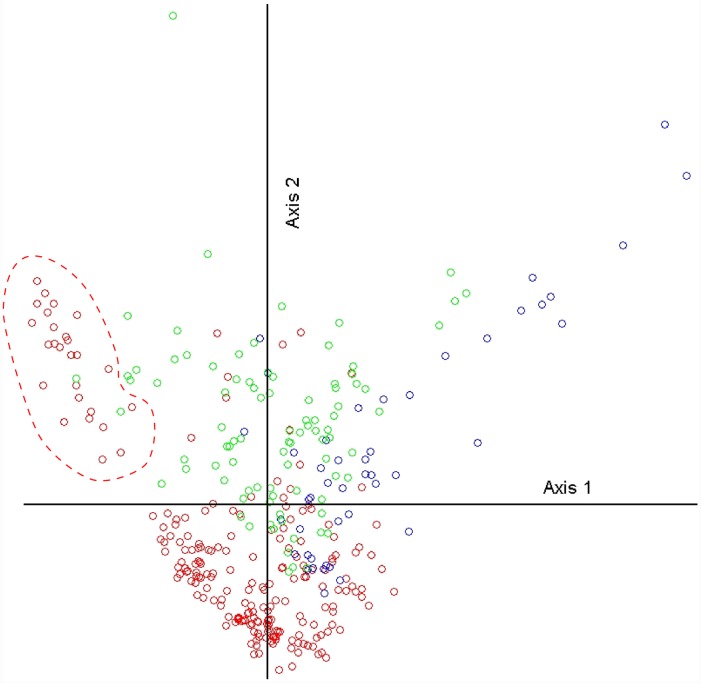
Fig 2. First two axes of the PCA ordination of sampled plots latitude within the environmental space.
Plots from latitude -13°S to -18°S correspond to the savanna supercluster (green circles). Plots from latitude -19°S to -31°S correspond to the desert supercluster (red circles). Plots from latitude -32°S to -34°S correspond to the Mediterranean supercluster (blue circles). Variance explained was 52.9%. Desert plots at the upper left side of Axis 1 (encircled) are from the Mitchell Grass Downs (see below). Mediterranean plots spread at the upper right side are from the Flinders Lofty Block (see below).

