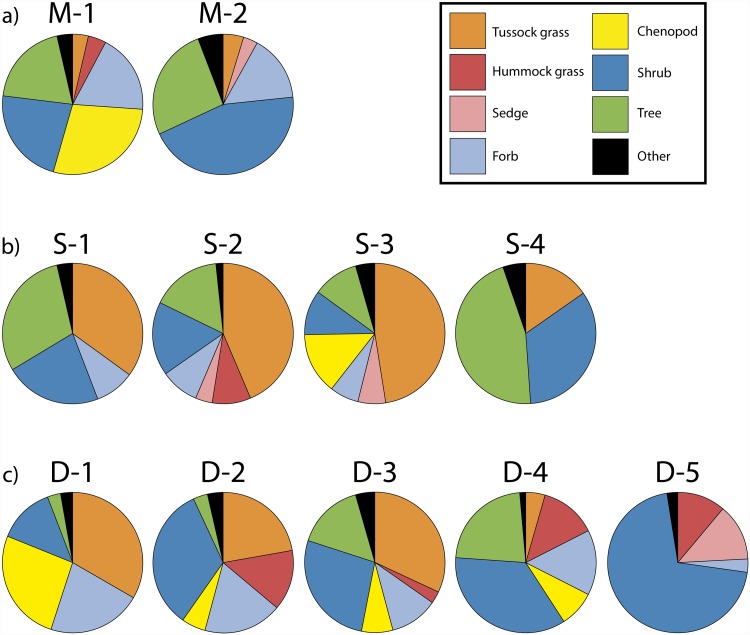
Fig 3. Growth form spectra.
(a) Clusters M1 and M2 within the Mediterranean supercluster. (b) Clusters S1 to S4 within the savanna supercluster. (c) Clusters D1 to D5 within the desert supercluster. Area of the chart slices represent the proportional contribution of the importance of each growth form. Growth forms with IVIs less than 5% are grouped as “Other”. Shrub mallee and tree mallee growth forms are integrated into shrub and tree growth forms, respectively. Images showing the physiognomy of the most representative vegetation type are displayed in S4 File.

