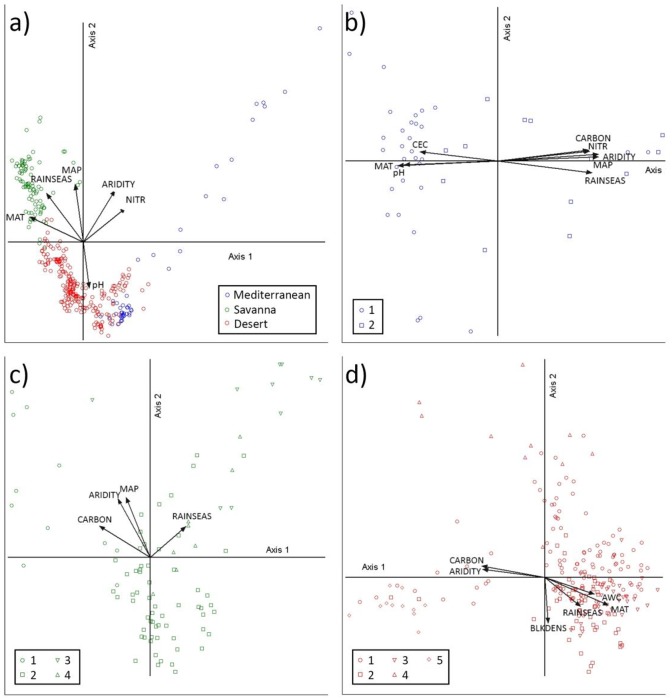
Fig 4. Biplots of the first two axes of the CCA ordination.
(a) All plots segregated by supercluster. Variance explained by Axes 1 and 2 = 0.9% and 0.9%. (b) Mediterranean supercluster showing clusters M1 and M2. Variance explained by Axes 1 and 2 = 4.2% and 3.8%. (c) Savanna supercluster displaying clusters S1 to S4. Variance explained by Axes 1 and 2 = 3.0% and 2.8%. (d) Desert supercluster segregated by clusters D1 to D5. Variance explained by Axes 1 and 2 = 1.5% and 1.4%. Arrows represent the most important environmental variables correlated with the plot ordination. Length of arrow is related to their correlation coefficient with ordination axes and is shown in S6 Table.

