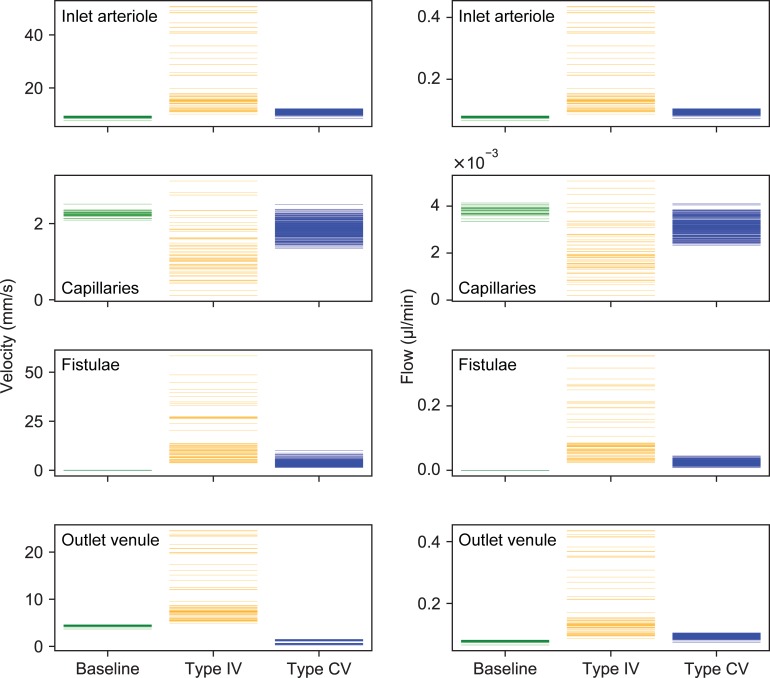
Fig 4. Hemodynamic parameters of computational AVM models.
Temporal mean of blood flow velocities (left column) and flow rates (right column) in the inlet arteriole (first row), capillary bed (second row, mean value over all capillaries), fistulous vessels (third row, maximum value over all fistulae) and outlet venule (fourth row) for all computed prototypes. Each solid line represents one prototype baseline (green), type IV (orange) and type CV (blue) configuration.

