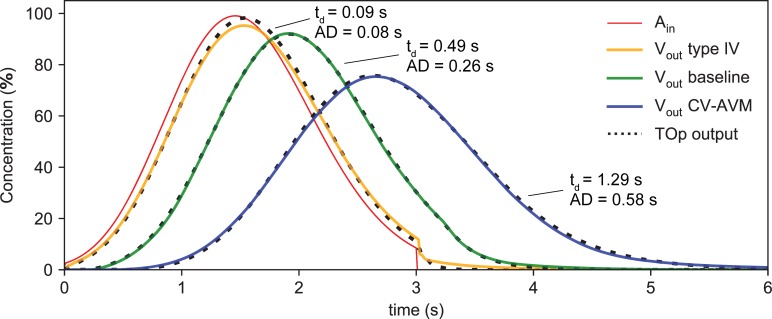
Fig 5. CA concentration at inlet and outlet nodes of computational AVM models.
Temporal evolution of CA concentration at the injection point Ain (red curve) and at the venular outlet node Vout of computational prototypes for baseline conditions (green), type IV (orange) and CV (blue) AVMs. The dashed black lines represent the output of the fitted TOp for each configuration.

