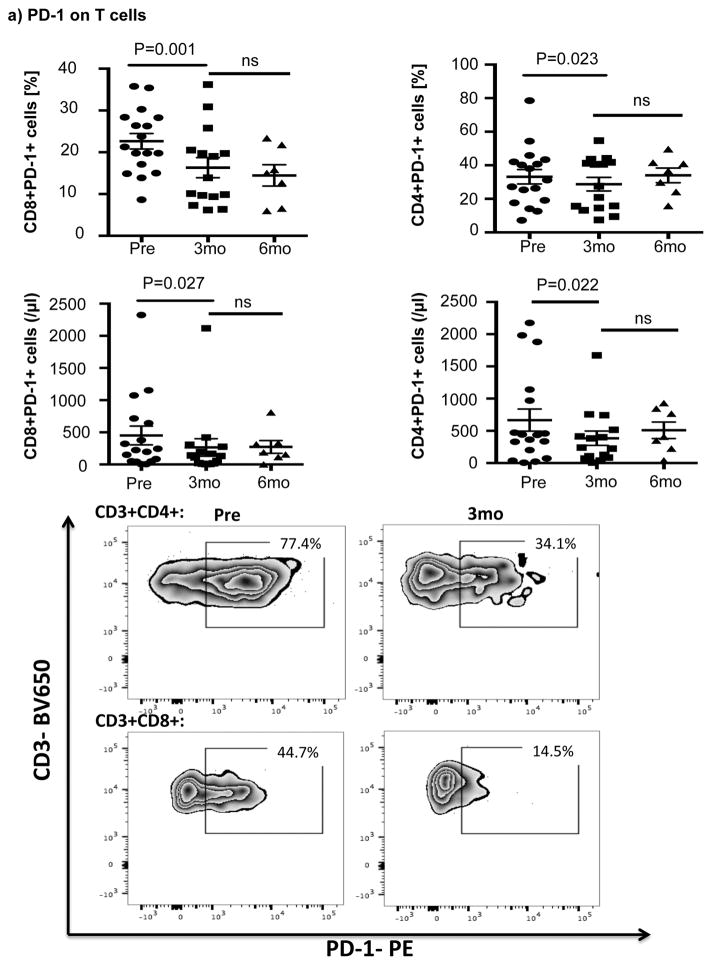
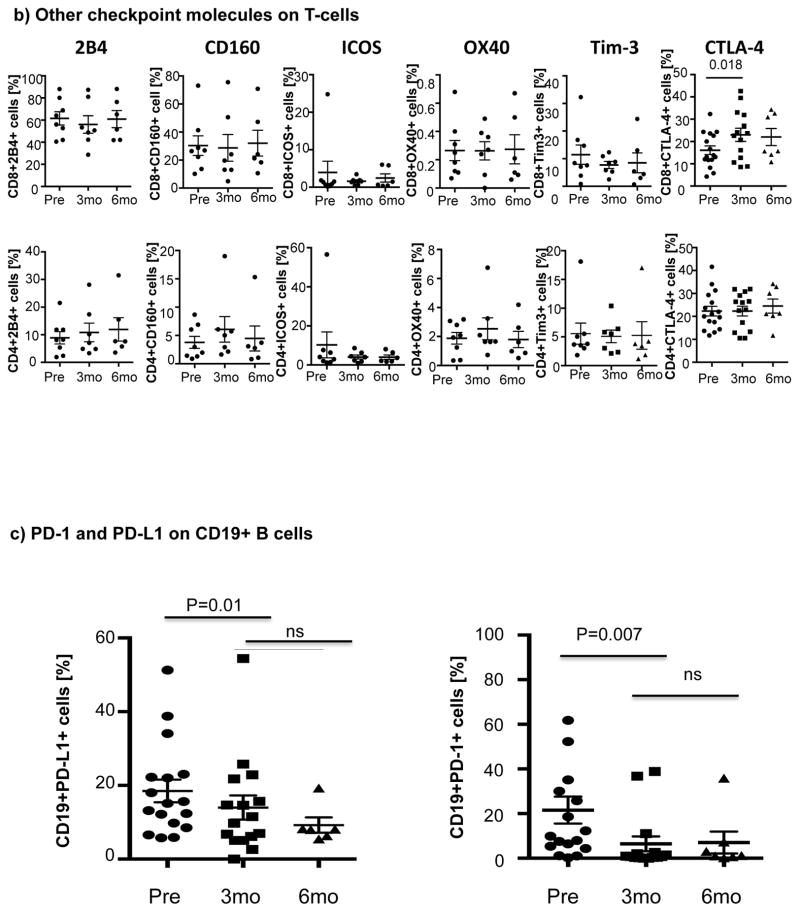
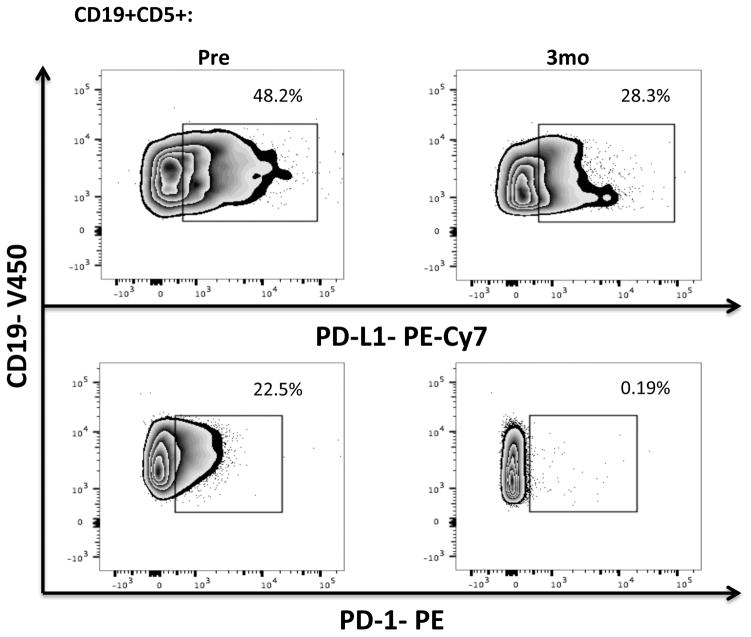
Figure 1. Expression of immune checkpoint molecules during ibrutinib therapy.
PBMCs were stained for CD19, CD5, CD3, CD4, CD8, PD-1 and PD-L1 expression. (a) Frequencies and absolute numbers of PD-1-expressing CD8+ and CD4+ T-cells, including representative FACS plots are shown. (b) PBMCs from 8 patients were stained for 2B4, CD160, ICOS, OX40 and Tim-3 (n=8) while those for 17 patients were stained for CTLA-4 (n=17). The p value is *0.0183 in CTLA-4 on CD8+ T-cells. (c) Frequencies of PD-L1 and PD-1-expressing CLL cells and representative FACS plots are shown (n=16).


