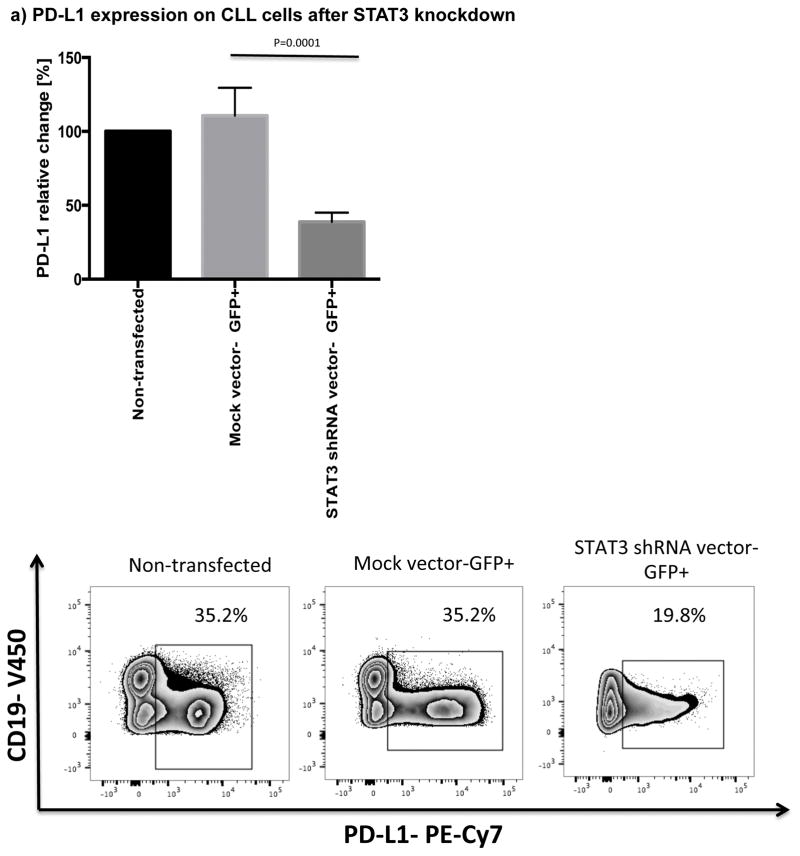
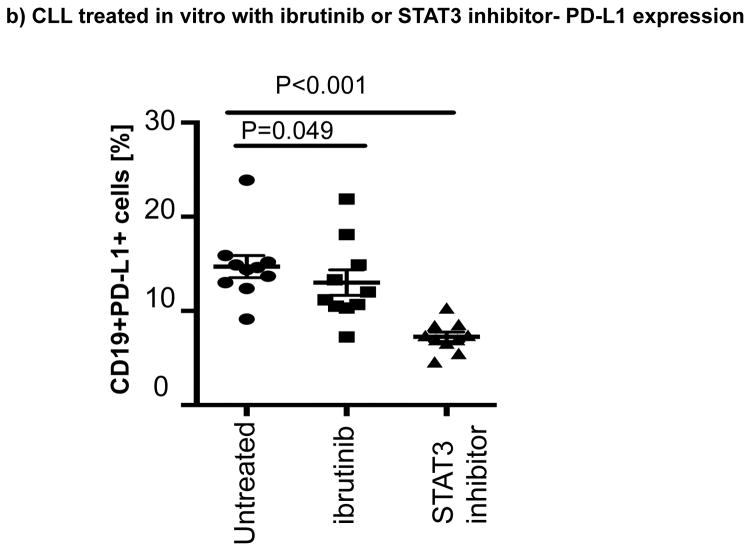
Figure 2. STAT3 modulates PD-L1 surface expression on CLL cells.
(a) CLL cells were treated with a GFP lentiviral hSTAT3 sh-RNA vector or a mock GFP lentiviral vector. After 48 hours of coculture with the viral supernatant, the cells were stained for viability, CD5, CD19 and PD-L1. Representative FACS plots are presented. The percent change in PD-L1 expression in GFP+CD19+CD5+ cells was measured and the percent change in expression was calculated using the following formula: (PD-L1+CD19+CD5+ cells [%] in transfected CLL samples(GFP+)) / (PD-L1+CD19+CD5+ cells [%] in non-transfected matching controls) x100 (n=3). (b) PBMCs from untreated CLL patients were cultured with ibrutinib (1 μM) or a STAT3 inhibitor (cucurbitacin, 0.05 μM) for 2 days, and then stained for viability, CD19, CD5 and PD-L1 expression (n=6).


