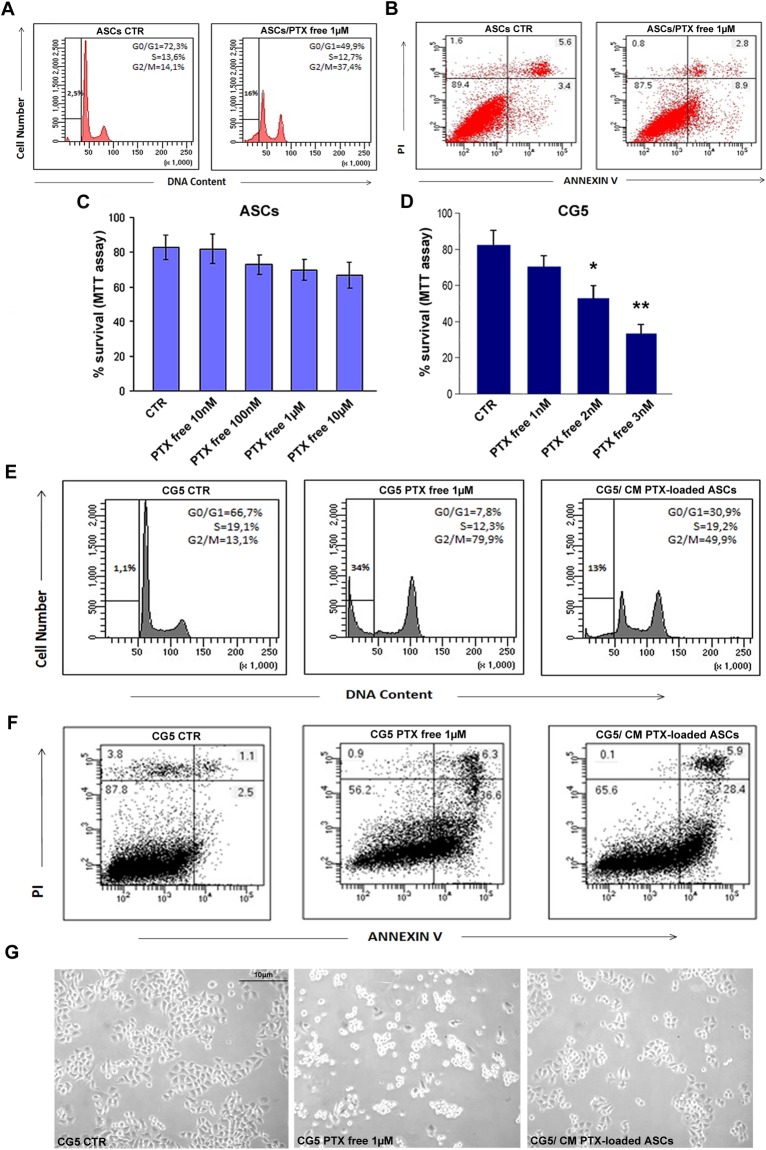
Fig 2. Cell cycle, survival and apoptosis of PTX treated ASCs and CG5.
A) Cell cycle analysis by flow cytometry of CTR (untreated) and PTX treated ASCs (1μM for 6 hours). Adherent and not adherent cells were processed for PI staining to evaluate cell cycle. B) Cytofluorimetric bi-parametric analysis of the annexin V versus PI staining assay. The percentage reported in the annexin V+/PI+ region of each histogram represents the apoptotic cells. C, D) MTT assay of ASCs and CG5 treated with different concentrations of PTX for 6 hours, respectively. E) CG5 cells were treated with PTX free at 1 μM or with conditioned medium previously obtained by PTX primed ASCs at 1 μM. Adherent and not adherent cells were processed for cell cycle analysis. The percentages of cells in the different phases of cell cycle were reported inside the relative histograms. F) Cytofluorimetric bi-parametric analysis of the annexin V versus PI staining assay. G) Representative images of CG5 cell cultures with different treatments. Abbreviation: CM, conditioned medium.t-test: * and ** indicate p< 0.01 and p< 0.001, respectively.

