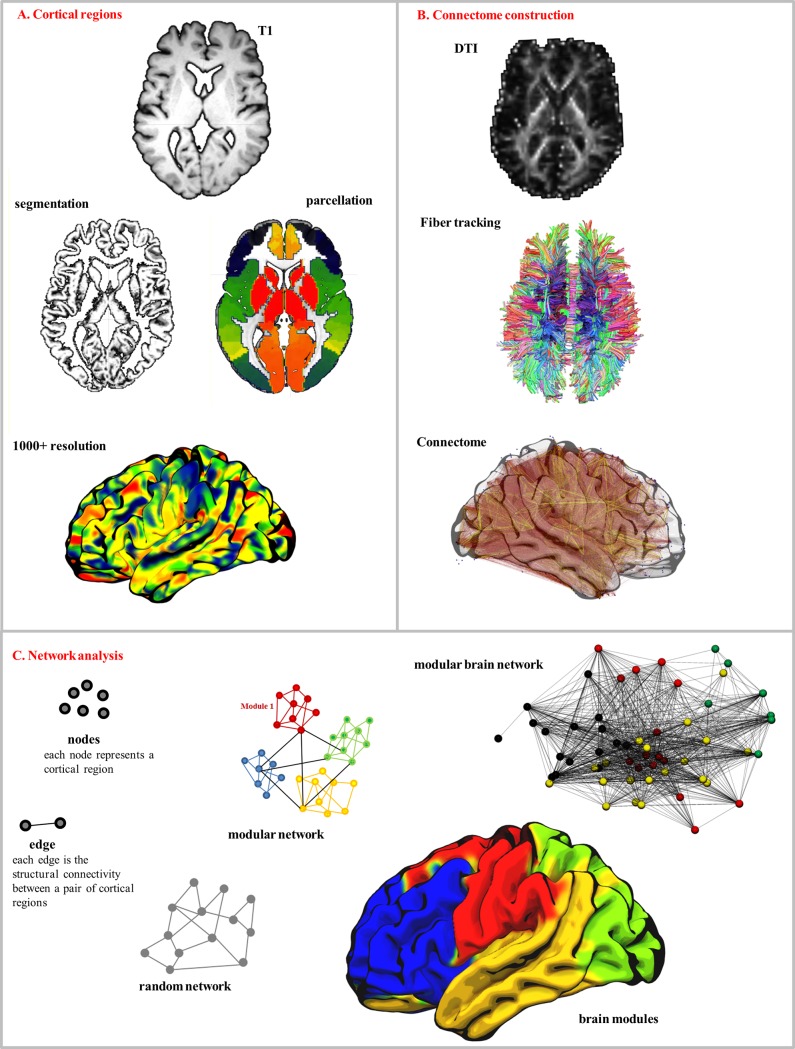
Fig 1. Connectome generation and network analysis.
In A, the T1 image is normalized, and segmented (into CSF, gray and white matter). The gray matter is parcellated into 1358 regions of interest (ROI). The T1 is warped into diffusion space where fiber tracking occurs, finding the connections between each pair of ROIs, generating a connectome, or network of connectivity between all brain regions. C is an example of whole brain modular partition into modules using Newman’s modularity algorithm, which groups ROIs that are more closely associated by their white matter networks and relatively segregated from surrounding groups (each module is represented by the same color).

