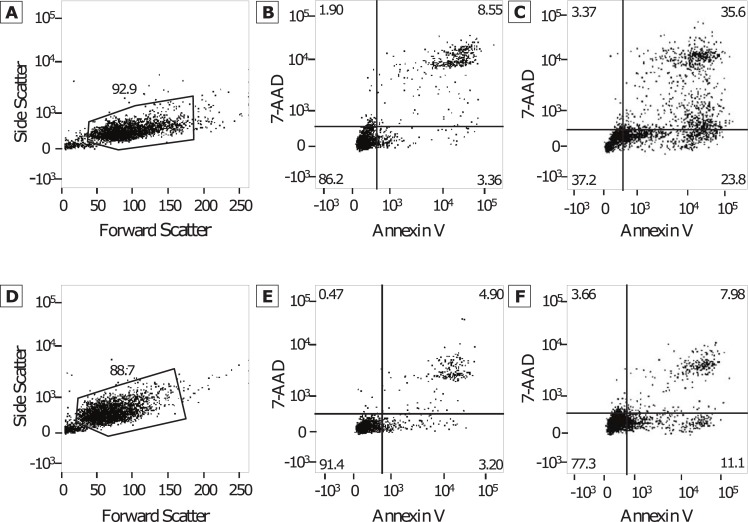
Fig 1. FACS analysis plots.
Representative examples of plots obtained using Annexin V and 7-AAD evaluated with FACS analysis, used to determine gaiting (A and C) and evaluation of the control samples (B and D) for SF767 (A and B) and U87-MG (C and D) glioma cell lines. The percentage of early apoptotic cells (lower right quadrant) and late apoptotic cells (upper right) were then used in assessment of cytotoxicity.

