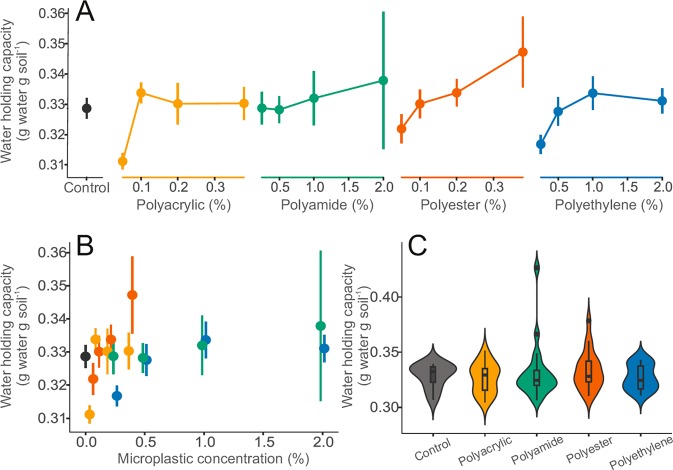
Figure 4.
Effects of microplastic particles on water holding capacity. (A) Visualization of the impact of microplastics on water holding capacity over the range of treatment concentrations. (B) Focusing on effects of microplastic concentration irrespective of microplastic type. For A and B, data were represented by mean and standard error (N = 5 per microplastic treatments, 10 for controls). (C) Summary of effect range of microplastic types for bulk density combining treatment concentration. Data distribution was depicted by violin plots with median, interquartile range and 95% confidence interval overlaid. Dots represent outlying data. Microplastic types are color-coded: controls (dark gray), polyacrylic (yellow), polyamide (green), polyester (red), and polyethylene (blue) treatments (i.e., linear microplastics are in warm colors: yellow and red, nonlinear microplastics are in cold colors: blue and green).

