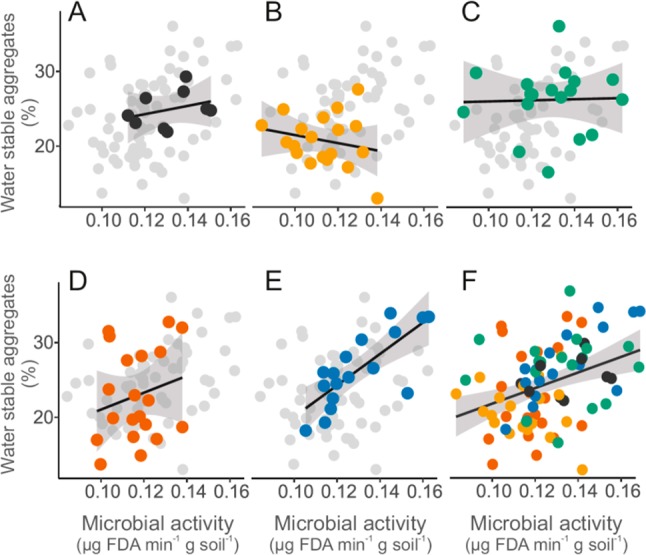
Figure 7.

Soil functional relationship between microbial activity and soil aggregation in control (A), or experimentally contaminated soils containing polyacrylic (B), polyamide (C), polyester (D), and polyethylene (E). The general association between these two proxies of soil health is unraveled on panel F (F = 13.01, r2 = 0.13, p < 0.001). In all panels dark gray, yellow, green, red, and blue colors represent control, polyacrylic, polyamide, polyester, and polyethylene treatments, respectively (i.e., linear microplastics are in warm colors: yellow and red, nonlinear microplastics are in cold colors: blue and green).
