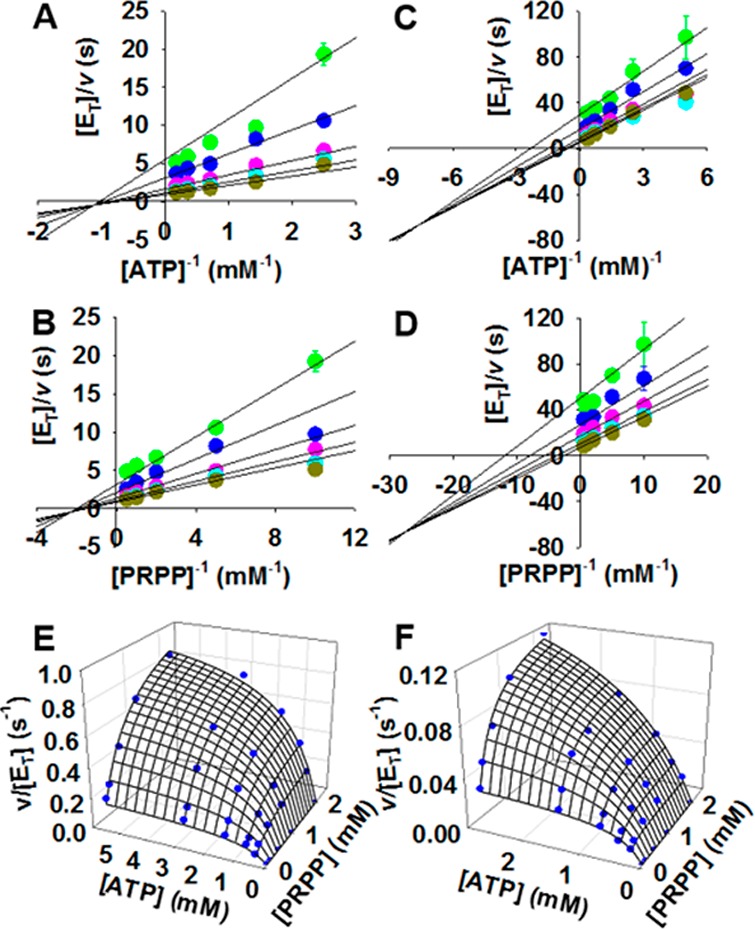
Figure 2.

Initial velocity patterns for PaATPPRT and PaHisGS. Intersecting double-reciprocal plots for PaATPPRT with (A) ATP and (B) PRPP as varying substrates and for PaHisGS with (C) ATP and (D) PRPP as varying substrates. Each color represents a different fixed concentration of the cosubstrate. Data points are mean ± SE. Three-dimensional plot of (E) PaATPPRT and (F) PaHisGS initial rate data, where lines are data fitting to eq 6.
