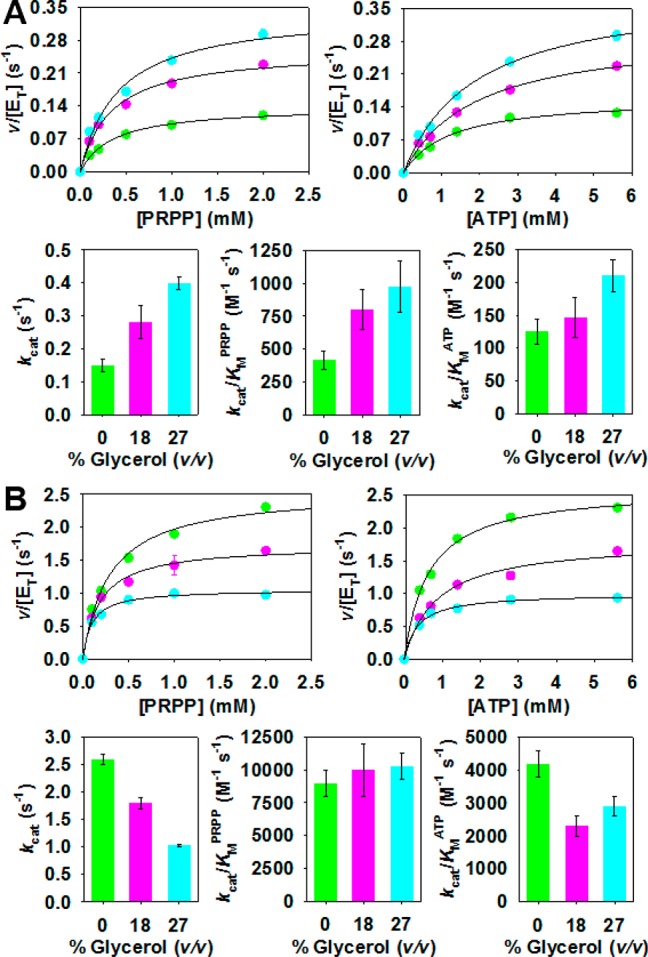
Figure 7.

Solvent viscosity effects on steady-state kinetics determined at 0% (green), 18% (pink), and 27% (cyan) glycerol (v/v). (A) PaHisGS saturation curves (top) and steady-state constants (bottom) dependence on glycerol concentration. (B) PaATPPRT saturation curves (top) and steady-state constants (bottom) dependence on glycerol concentration. Data represent either mean ± SE (scatter plots) or value ± fitting error (bar plots). Lines are data fitting to eq 3.
