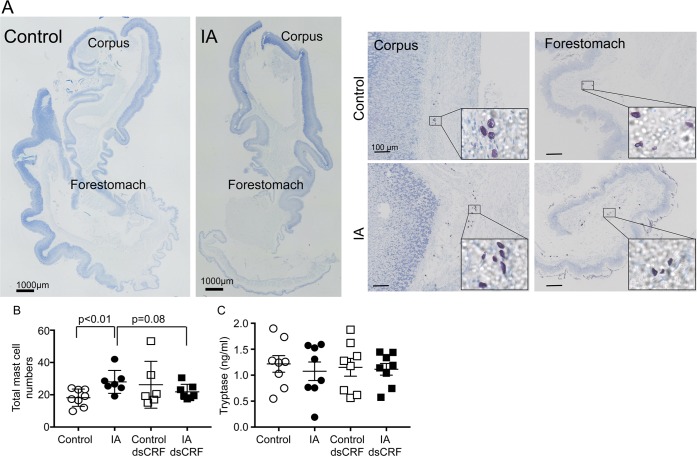
Fig 2. Modulation of mast cell infiltration in FD model.
(A) Representative stitched images of toluidine blue-stained stomach sections of control and IA rats (scale bar = 1000μm). Magnified images of the corpus and the forestomach areas are shown (scale bar = 100μm); inset: zoomed-in mast cells. (B) Two-way ANOVA showed significant main interaction between IA treatment and CRF-RNAi injection (p<0.05). Mast cell numbers were higher in IA-treated rats than control rats (p<0.01; Student’s t-test; IA: 28.0 ± 2.7 vs. Control: 18.2 ± 1.9; n = 7-8/group). In IA-treated rats, dsCRF injection tended to decrease the numbers of mast cells compared with vehicle-injected controls (p = 0.08; Student’s t-test; IA: 28.0 ± 2.7 vs. IA dsCRF: 21.8 ± 1.8; n = 7-8/group). (C) Mast cell tryptase levels in gastric lysates did not differ between control and IA-treated groups.

