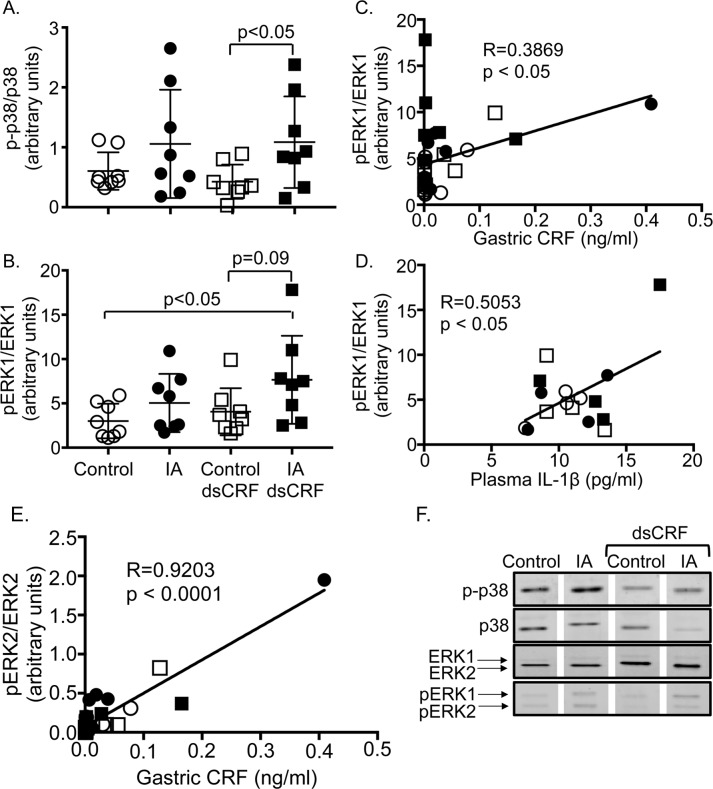
Fig 8. Modulation of phosphorylation of MAPK in FD.
Western blot analyses showing quantification of phosphorylated levels of p38 and ERK1/2. Total levels of p-38 and ERK1/2 were used for normalization. (A) Two-way ANOVA showed significant main effect of IA treatment on p-p38 levels (p = 0.018). Levels of p-p38 increased in IA-treated rats compared to controls after CRF-RNAi (p<0.05; Student’s t-tests; n = 8/ group). (B) Two-way ANOVA revealed a significant main effect of IA treatment on pERK1 levels (p = 0.026). Levels of pERK1 increased in IA-treated rats after CRF-RNAi compared to controls (p = 0.09; Student’s t-tests; n = 8/group). (C) Linear regression analyses showed that the levels of pERK1 in the stomach were directly proportional to the CRF levels in the stomach (R = 0.3869, p<0.05). (D) Linear regression analyses showed that the levels of pERK1 correlated directly to the plasma levels of IL-1β (R = 0.5053, p<0.05). (E) Linear regression analyses showed that levels of pERK2 in the stomach were directly proportional to gastric CRF levels (R = 0.9192, p<0.0001). Empty circles (Control), filled circles (IA), empty squares (Control dsCRF), and filled squares (IA dsCRF). (F) Representative Western blots showing gastric p-p38, p38, ERK1/2, and p-ERK1/2 levels.

