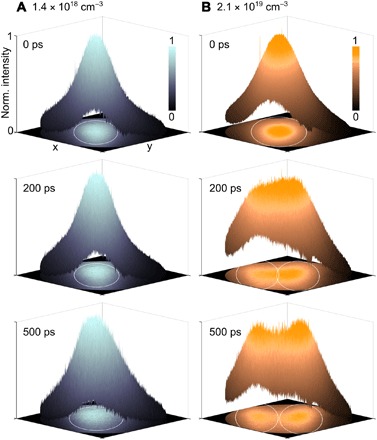
Fig. 2. Pulling apart photoexcited electrons by optically inducing spatially varying electric fields within the photoexcitation spot at high photoexcited carrier densities.

We show snapshots of the normalized spatial distribution of the photoexcited electrons at three different time delays after photoexcitation (0, 200, and 500 ps) for both (A) low and (B) high photoexcited carrier densities. (A) At low carrier density (1.4 × 1018 cm−3), the photoexcited electrons exhibit well-known diffusion phenomena while continuing to retain a Gaussian distribution. (B) At high carrier density (2.1 × 1019 cm−3), the initial Gaussian profile of the photoexcited electrons at 0 ps starts to separate at +200 ps and eventually splits into two distinct distributions with the separation between the two fitted Gaussian peaks greater than the FWHM of the distributions. White elliptical lines in the XY plane demarcate the FWHM of the distributions.
