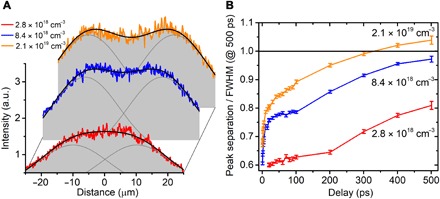
Fig. 3. Control of rate of separation of the photoexcited electron clouds.

(A) Distribution profile at +500 ps for three different photoexcited carrier densities ranging from a flat-top Gaussian to two overlapping Gaussian distributions with varying amount of separations. For quantitative analysis, the time-delayed distribution profiles are fitted with two Gaussian distributions of the same width and amplitude, leaving the peak positions as free parameters for fitting. The solid black lines show the distribution profiles that arise from the two fitted overlapping Gaussian distributions (solid gray lines). (B) Fitted peak separations as a ratio of the FWHM of their respective profiles at +500 ps for the three different carrier densities. The degree and rate of separation of the quasi-equilibrium distributions can be controlled by tuning the photoexcitation intensities. a.u., arbitrary units.
