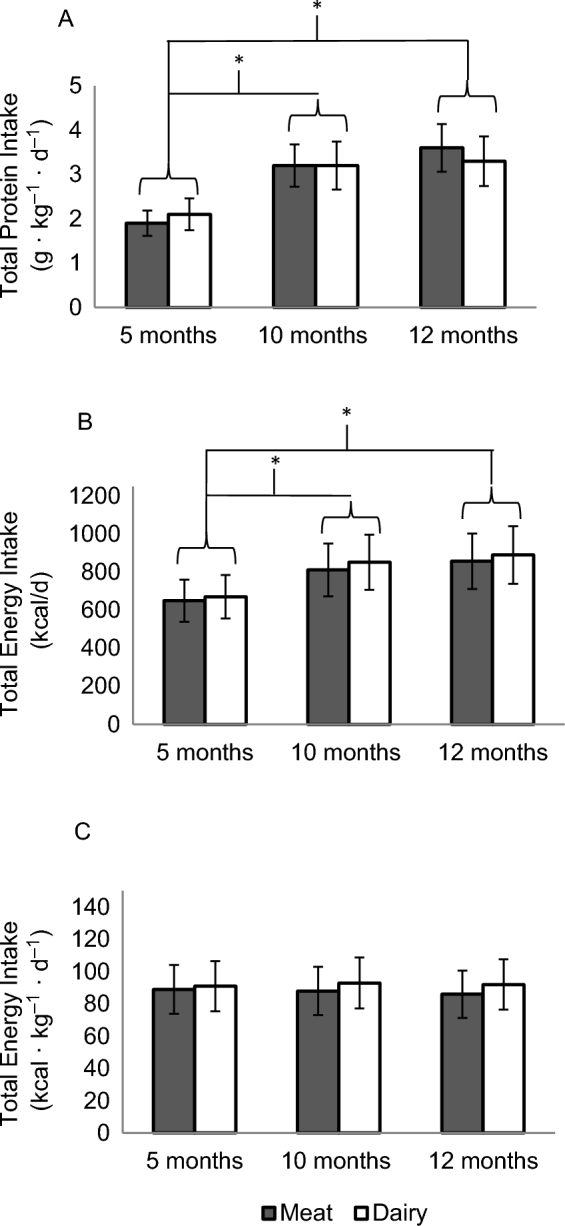
FIGURE 2.

Total protein (A) and energy (B, C) intakes (means ± SDs) at 5, 10, and 12 mo of age. Repeated-measures ANOVA of time and group (meat compared with dairy: n = 32 compared with n = 32). Total protein (A) and total energy (B) intakes increased from baseline to 10 and 12 mo. (A) *Group-by-time interaction, P = 0.66; main effect of time, P < 0.001. (B) *Group-by-time interaction, P = 0.53; main effect of time, P < 0.005. There was no difference in protein intake between 10 and 12 mo or between groups at any time points. (C) Total energy intake did not change over time or differ between groups. Dairy, dairy-based complementary protein group; Meat, meat-based complementary protein group.
