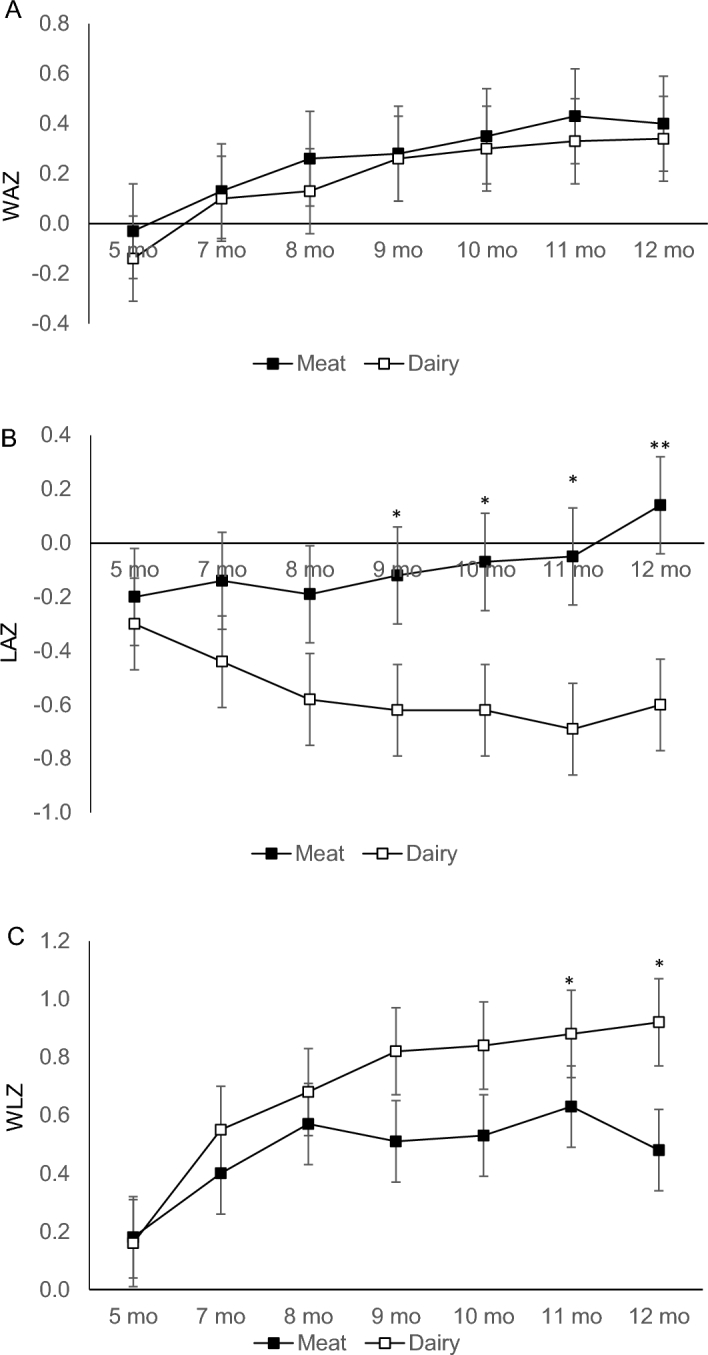
FIGURE 3.

WAZ (A), LAZ (B), and WLZ (C) at baseline and at 7, 8, 9, 10, 11, and 12 mo of age (mean ± SD). Repeated-measures ANOVA of time and group (Meat compared with Dairy: n = 32 compared with n = 32) with maternal BMI and height as covariates. (A) Group-by-time interaction, P = 0.49. There was a significant main effect of time only (P = 0.0006). (B) Significant group-by-time interaction, P = 0.00001. LAZ differed between groups at 9, 10, 11, and 12 mo of age: *P < 0.05, **P = 0.001. (C) Significant group-by-time interaction, P = 0.015. WLZ differed between groups at 11 and 12 mo of age, *P = 0.03. Dairy, dairy-based complementary protein group; LAZ, length-for-age z score; Meat, meat-based complementary protein group; WAZ, weight-for-age z score; WLZ, weight-for-length z score.
