. 2018 Aug 16;7:e34625. doi: 10.7554/eLife.34625

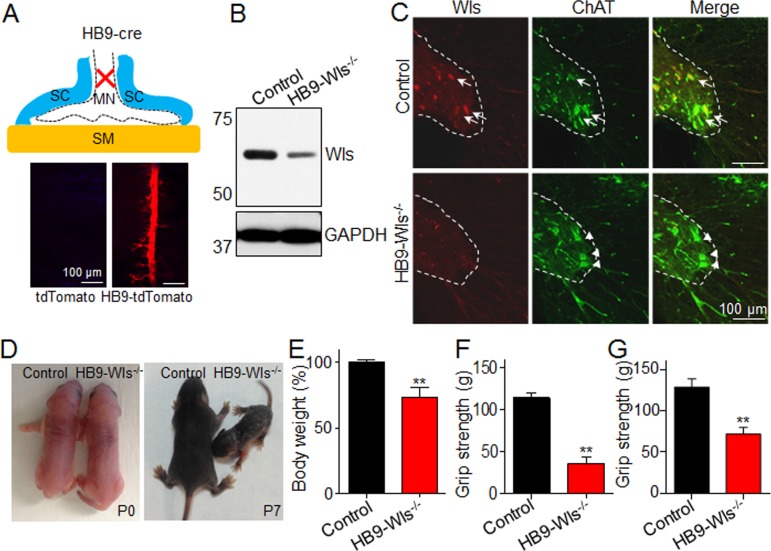
Figure 2. Ablation of Wls expression in motoneuron causes muscle weakness.

(A) Up: NMJ structure. Cre targets motoneuron (HB9::cre). Down: Cre expression was verified by crossing HB9::cre mice with Rosa-tdTomato reporter mice (HB9-tdTomato). HB9::cre drives tdTomato expression in the middle line of diaphragm where motoneuron innervates in the muscle (HB9-tdTamato, (P7). MN, motoneuron; SC, Schwann cells; SM, skeletal muscle. (B) Immunoblot of Wls in sciatic nerve from 2-month-old control and HB9-Wls-/- mutant. Notice that the reduced Wls protein expression in the mutant. (C) Immunostaining of Wls in spinal cord from 2-month-old control and HB9-Wls-/- mutant. Notice that Wls staining signal is lost in the ChAT positive cells in the spinal ventral horn in the HB9-Wls-/-. Anti-Wls (Red); Anti-ChAT (Green). Arrows indicate colocalization of Wls and ChAT protein. (D) Two genotypes at P0 and P7. Notice that apparent normal size at P0, and reduced body size at P7. (E) Body weight of two genotypes at P7. Control, n = 20; mutant, n = 11; Unpaired t-test, **p<0.01. (F) Grip strength of two genotypes at P60. Control, n = 5; mutant, n = 5. Unpaired t-test, **p<0.01. (G) Grip strength of two genotypes with same body weight at P60. Control, n = 5; mutant, n = 5. Unpaired t-test, **p<0.01.

Figure 2.

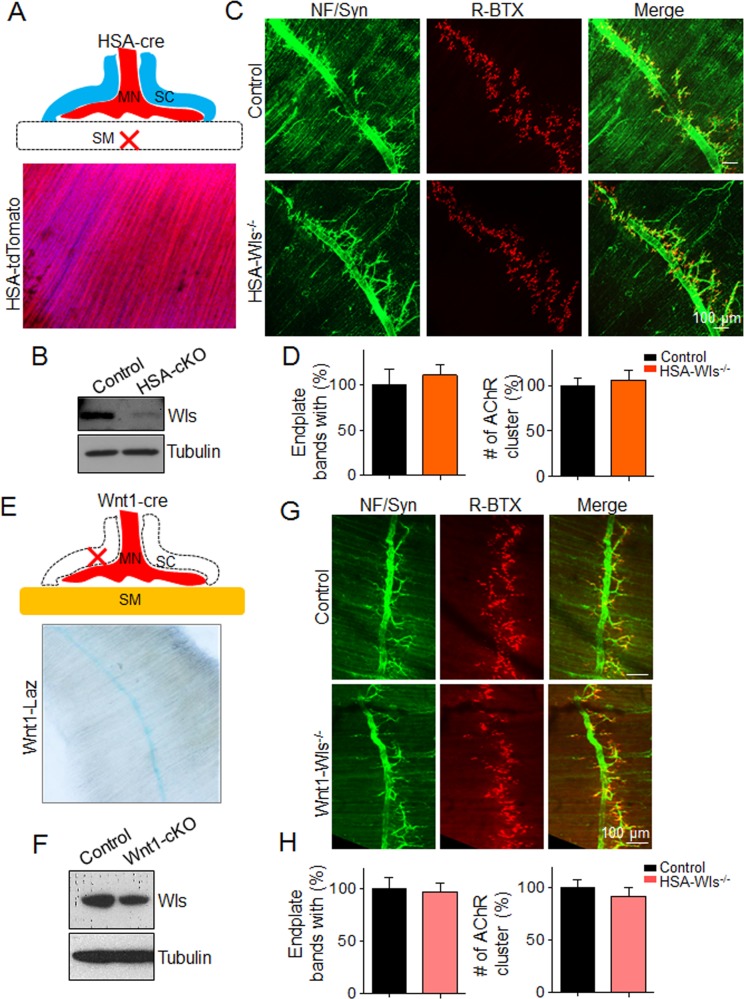
Figure 2—figure supplement 1. Ablation of Wls in skeletal muscle or Schwann cell has no apparent NMJ morphological defects.

Figure 2—figure supplement 1.

(A) Up: NMJ structure. Cre targets skeletal muscle (HSA::cre). Down: Cre expression was verified by crossing HSA::cre mice with Rosa-tdTomato reporter mice (HSA-tdTomato, (P7). HSA::cre drives tdTomato protein expression in each muscle fiber of diaphragm. (B) Immunoblot of Wls protein in gastrocnemius of P5 control and HSA-Wls-/- mice. (C) Immunostaining of NMJs in diaphragms of P5 control and HSA-Wls-/- mice with anti-NF and anti-Syn (Green). R-BTX stains postsynaptic AChR (Red). Control: Cre or Wlsf/f littermates. (D) Statistical results of endplate width (Left), AChR number (Right) in B. n = 5 mice per group; Unpaired t-test. p>0.05. (E) Up: NMJ structure. Cre targets Schwann cells (Wnt1::cre). Down: Cre expression was verified by crossing Wnt1::cre mice with Rosa-Laz reporter mice (Wnt1-Laz, (P7). Wnt1::cre drives laz expression in middle line of diaphragm where Schwann cells surround the innervated motor axons (Wnt1-Laz). (F) Immunoblot of Wls protein in sciatic nerve of E18.5 control and Wnt1-Wls-/- mice. (G) Immunostaining of NMJs in diaphragms of E18.5 control and Wnt1-Wls-/-with anti-NF and anti-Syn (Green), R-BTX (Red). Control: Cre or Wlsf/f littermates. (H) The statistics of endplate width (Left), AChR number (Right) in E. n = 5 mice per group; Unpaired t-test. p>0.05.
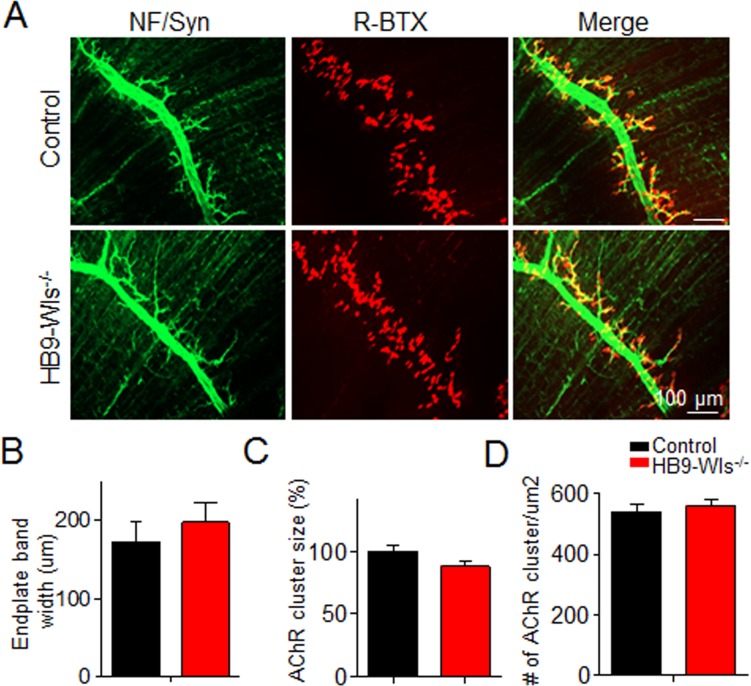
Figure 2—figure supplement 2. NMJ formation appears grossly normal in HB9-Wls-/- mice.

Figure 2—figure supplement 2.

(A) Immunostaining of NMJs in diaphragm of E18.5 control and HB9-Wls-/- embryos with anti-NF and anti-Syn to label motoneuron axons and synaptic vesicles (Green). R-BTX stains postsynaptic AChR (Red). (B) Statistical results of endplate band width of two genotypes. n = 3 mice per group; Unpaired t-test, p>0.05. (C) Statistical results of AChR cluster size. n = 3 mice per group; Unpaired t-test, p>0.05. (D) Statistical results of AChR number. n = 3 mice per group; Unpaired t-test, p>0.05.
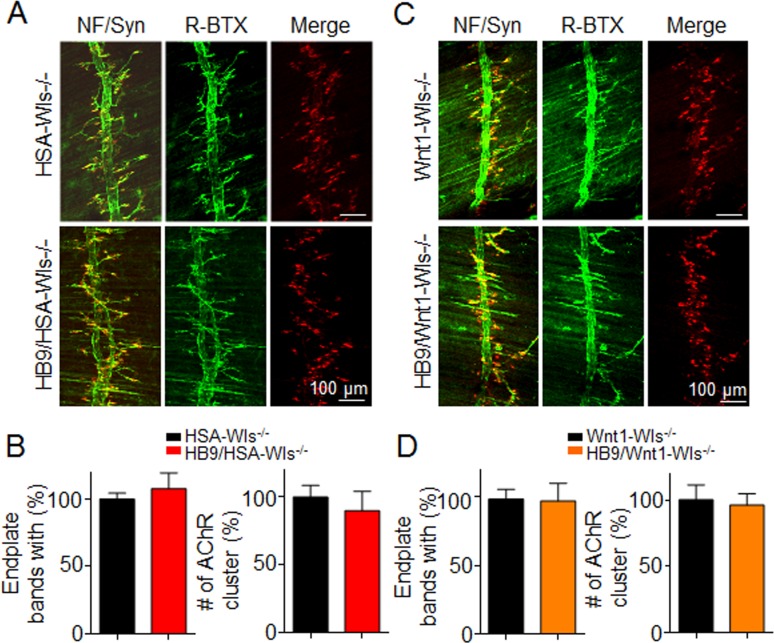
Figure 2—figure supplement 3. Comparable NMJ formation between HSA-Wls-/- and HB9/HSA-Wls-/-, Wnt1-Wls-/- and HB9/Wnt1-Wls-/- mice.

Figure 2—figure supplement 3.

(A) Immunostaining of NMJs in diaphragms of HSA-Wls-/- and HB9/HSA-Wls-/- E18.5 embryos with anti-NF/Syn (Green). R-BTX stains postsynaptic AChR (Red). Scale bar, 100 μm. (B) The statistics of endplate width and AChR cluster number in A. n = 3 mice per group; Unpaired t-test. p>0.05. (C) Immunostaining of NMJs in diaphragms of Wnt1-Wls-/- and HB9/Wnt1-Wls-/- E18.5 embryos with anti-NF/Syn (Green). R-BTX stains postsynaptic AChR (Red). Scale bar, 100 μm. (D) The statistics of endplate width and AChR cluster number in C. n = 3 mice per group; Unpaired t-test. p>0.05.