
Figure 3: Three-color imaging of XLF binding and SR-complex formation.
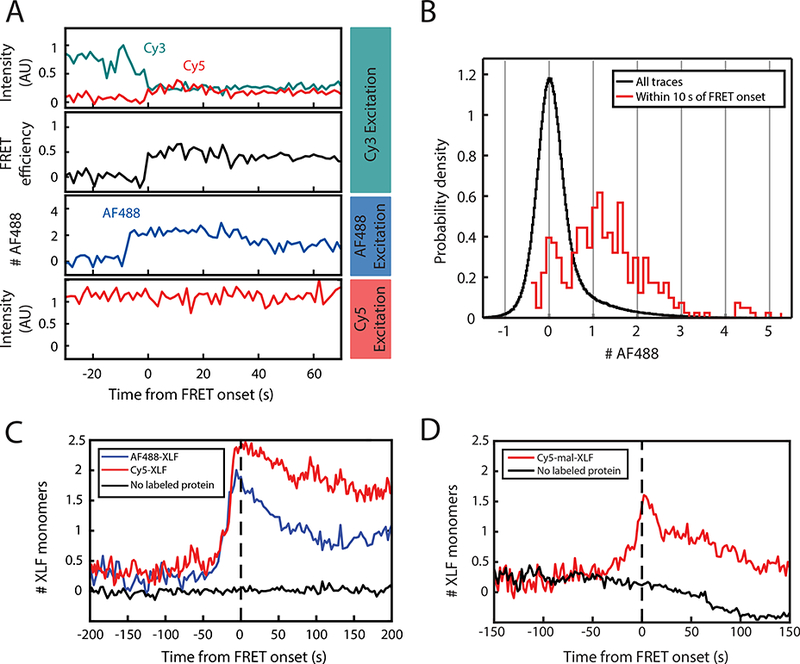
(A) 3-color single-molecule imaging of FRET between Cy3 and Cy5-labeled DNA ends, along with binding of Halo-tagged XLF protein labeled with Alexa Fluor 488 (AF488-XLF). Top panel: Intensity in the Cy3 (cyan) and Cy5 (red) channels with excitation of Cy3. Second panel: Calculated Cy3-Cy5 FRET efficiency. Third panel: AF488 intensity, expressed as a multiple of the intensity of single-AF488 reference spots. Bottom panel: Cy5 intensity with direct excitation. See Supplementary Fig. 2F for additional traces.
(B) Histogram of AF488 intensity, expressed as a multiple of the average intensity of single-AF488 reference spots. The black curve includes all substrates, while the red curve includes only the subset of frames within 10 s of the transition to high FRET.
(C) Average of AF488-XLF and Cy5-XLF stoichiometry for traces aligned at the time of FRET onset. AF488 intensity, normalized to the intensity of single-AF488 reference spots, was divided by the protein labeling fraction to give XLF protein stoichiometry. Cy5 intensity, normalized to single-Cy5 intensity (see Supplementary Fig. 3A), was divided by protein labeled fraction after subtracting 1 to account for the single Cy5 label on the DNA. Black curve shows data from a mock AF488 imaging experiment without AF488-XLF protein.
(D) Average stoichiometry of XLF nonspecifically labeled on cysteines with Cy5-maleimide, aligned at the time of FRET onset. Cy5-mal-XLF stoichiometry was calculated as for Cy5-XLF in panel (C). Black curve shows data from a control experiment in the absence of Cy5-mal-XLF. The decay of the black curve below zero results from photobleaching of the Cy5 label on DNA.