
Figure 3.
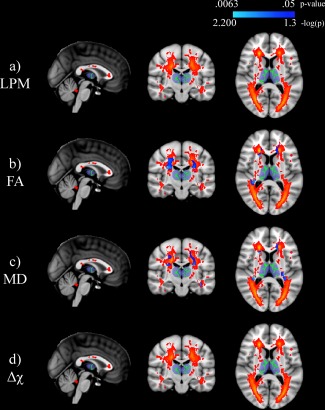
Lesion probability mapping (LPM) of multiple sclerosis (MS) patients relating white matter (WM) lesion location to mean thalamic WM skeleton (shown in green) parameters. The top panel shows the LPM image with warmer colors corresponding to increased probability of a lesional voxel in the MS cohort. Significant associations (p < .05) are shown in blue to light blue with p‐values having been log transformed for improved visibility. The Harvard‐Oxford thalamic ROI is shown for reference in transparent blue. Note that there are no significant associations with lesion location and mean susceptibility of the thalamic WM skeleton. The slice shown corresponds to standard space MNI coordinates of X = 0, Y = −17, Z = 8. Abbreviations:FA = fractional anisotropy; MD = mean diffusivity; Δχ = magnetic susceptibility; LPM = lesion probability mapping; WM = white matter; MS = multiple sclerosis [Color figure can be viewed at http://wileyonlinelibrary.com]